![]()
EXECUTIVE SUMMARY
- International comparisons underscore that Malaysia’s middle class presently shares similar vulnerabilities with other economies. Like the “squeezed middle” in the US and OECD countries, Malaysia’s M40 exhibits declining financial security and rising inequality risks.
- Despite rising absolute incomes, the pace of growth has slowed while household expenditure has risen sharply. Spending is increasingly allocated to essentials such as housing, transport, and food, alongside new necessities such as internet access and digital services.
- The resilience of Malaysia’s middle class is increasingly determined by occupational structure. This analysis adopts the occupational pyramid as a more strategic framework, moving beyond the conventional B40/M40/T20 income categorization.
Introduction
Malaysia’s middle-income class, referred to as M40, comprises households with a monthly income ranging from RM5,250 to RM11,819, accounting for 40% of the population. This group is widely regarded as a key driver of the nation’s economic growth; it makes a crucial contribution to domestic consumption, accounting for 40% of total private consumption in 2024, followed by the T20 group (37%) and the B40 group (22%).
The middle class is a social classification reflecting the ability to lead a comfortable life with stable job security and retirement prospects. However, in the Malaysian context, a considerable share of middle-income households does not perceive themselves as genuinely belonging to the middle class due to growing financial pressures.
The 13th Malaysia Plan (13MP) 2026-2030 aims to raise the floor and ensure improved quality of life as the country transforms into a high-income nation. In this context, advancing the middle class is critical because this group needs support for continual skills upgrading and access to education opportunities in AI, STEM, and technology leapfrogging. This paper examines the income profiles of the middle class and explores the occupational framework as an alternative lens of analysis.
The Middle Class: Definitions and Global Perspectives
The concept of the middle class has evolved from the historical bourgeoisie—merchants and professionals—to complex modern definitions. Relative measures vary, with the OECD adopting a range of 75–200% of median income, while developing economies often use absolute thresholds based on daily spending.
The U.S. and OECD: A shrinking share of income
The U.S. middle class has steadily eroded, marked by shrinking income shares and widening inequality. Census data show its share of income fell from 40.4% in 1996 to 38.0% in 2012. OECD (2019) reports similar challenges across advanced economies, citing globalization, technology, and rising housing costs as key pressures.
Southeast Asia: Rapid expansion vs. structural barriers
ASEAN’s middle class may comprise two-thirds of the global middle class by 2030. Yet, many remain clustered at the lower end, vulnerable to shocks such as job loss or health costs. Structural barriers—including education and geography—limit upward mobility, and wealth gains often concentrate in urban groups.
Malaysia: Persistent inequality and fragmented protection
Malaysia’s middle class is expanding but remains fragile. The World Bank (2025) highlights limited mobility and disparities across states and ethnic groups. The Khazanah Research Institute (2024) argues that the B40/M40/T20 categories oversimplify reality, as many “middle-class” households trade off essentials for aspirational goods.
Income dynamics of Malaysia’s middle-class households
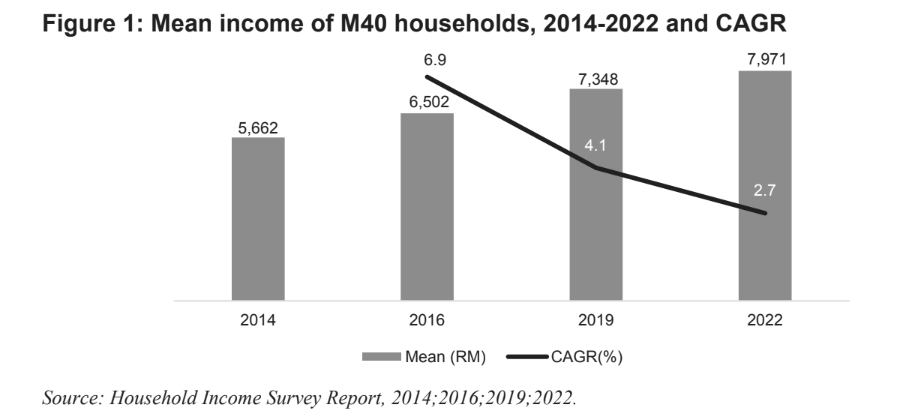
The income dynamics of Malaysia’s M40 group demonstrate both upward mobility and structural transformations. Between 2014 and 2022, mean household income rose steadily from approximately RM5,700 to RM8,000, reflecting sustained improvements in absolute income levels.
However, the compound annual growth rate (CAGR) shows a clear downward trend. This indicates that although households are earning more in absolute terms, the pace of income growth has moderated over time, failing to keep up with the sharp rise in household expenditure for essentials and digital services.
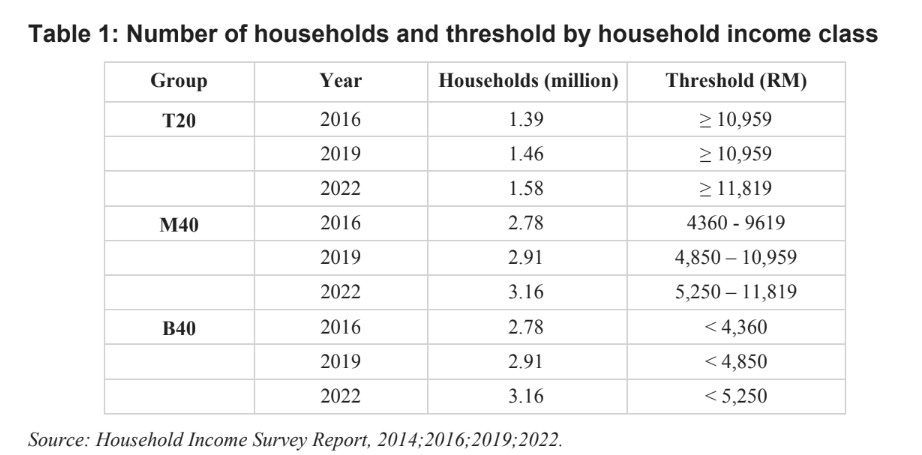
At the same time, there is an upward shift in income thresholds for M40 households, illustrating the widening of the income brackets for this group. The threshold has shifted from RM4,360–9,619 in 2016 to RM4,850–10,959 in 2019, and reached RM5,250–11,819 by 2022.
Parallel to this widening, the number of households within the M40 category has expanded significantly. This expansion underscores the increasing proportion of Malaysian households attaining middle-class status, thereby strengthening the demographic weight of the M40 in the national landscape.
Growth of M40 households accelerated to 2.8% annually between 2019 and 2022
The rate of household growth accelerated from approximately 1.6% annually in the 2016–2019 period to 2.8% annually between 2019 and 2022. In absolute terms, the M40 population rose from 2.78 million households in 2016 to 2.91 million in 2019, and further to 3.16 million in 2022.
To conclude, these findings suggest that the widening of Malaysia’s middle class has been driven more by the increasing number of households transitioning into the M40 group than by robust income growth within the group itself. While income levels have risen, the deceleration of growth rates points to emerging structural challenges in sustaining upward mobility.
This has important implications for policymakers, as it highlights the need to focus not only on expanding middle-class participation but also on enhancing income growth and resilience within the M40 segment to ensure long-term socioeconomic stability.
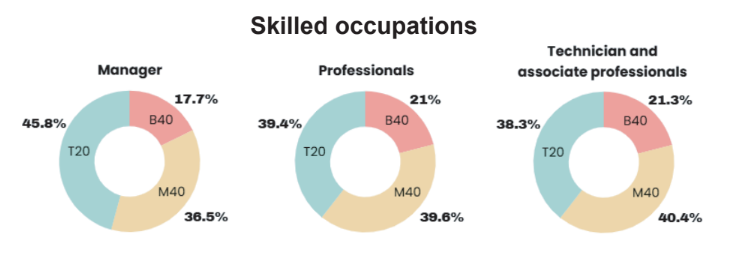
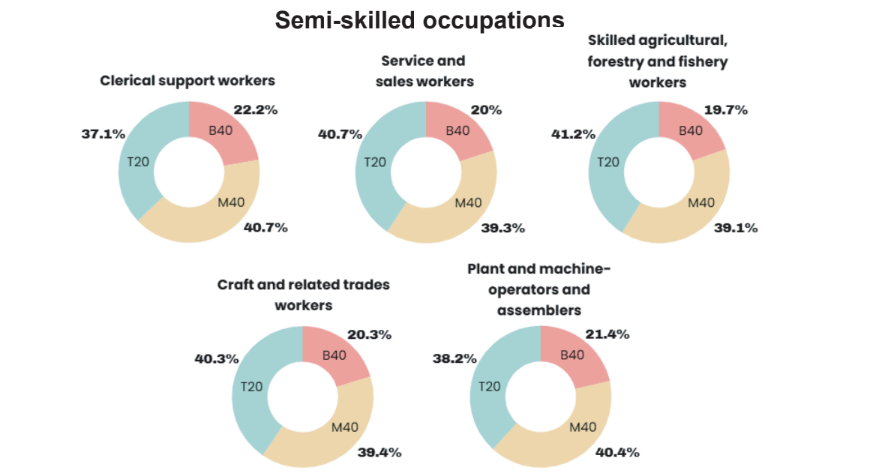
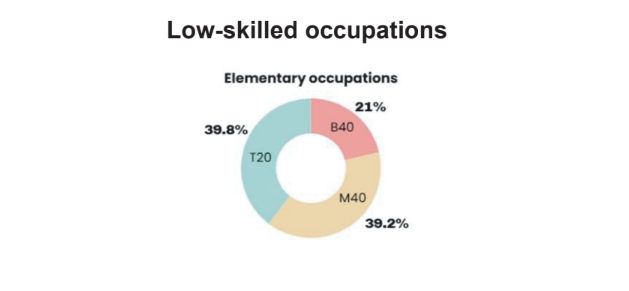
4. Economic activities in shaping middle-income class
In 2022, the M40 group held about 36–41% of income share across most occupations, highlighting its structural role in Malaysia’s workforce. This group is largely composed of skilled and semi-skilled workers, acting as a key driver of income distribution in the economy.
5. Household consumption expenditure in Malaysia
Consumption expenditure refers to the portion of income spent on private consumption of goods and services, which plays an important role in accelerating the domestic economy. In Malaysia, household consumption expenditure is monitored and published by the Department of Statistics Malaysia (DOSM). Following the United Nations Statistics Division (UNSD), there are 13 detailed Classification of Individual Consumption According to Purpose (COICOP) categories as displayed in Figure 2.
The composition of household consumption expenditure across various income classes shows that in general, housing, water, electricity, gas and other fuels make up the largest share of household expenditure, accounting for at least one-fifth of the total expenditure. Lower-income groups tend to spend more compared to other income groups. For instance, households in the bottom 10% of the income group spent 27.7% of their total expenses on this category, while households within 50-70 income deciles used about 22% of their expenses.
Figure 2: Composition of household consumption expenditure by income class, Malaysia, 2022

Expenditure Patterns of Middle-Income Households
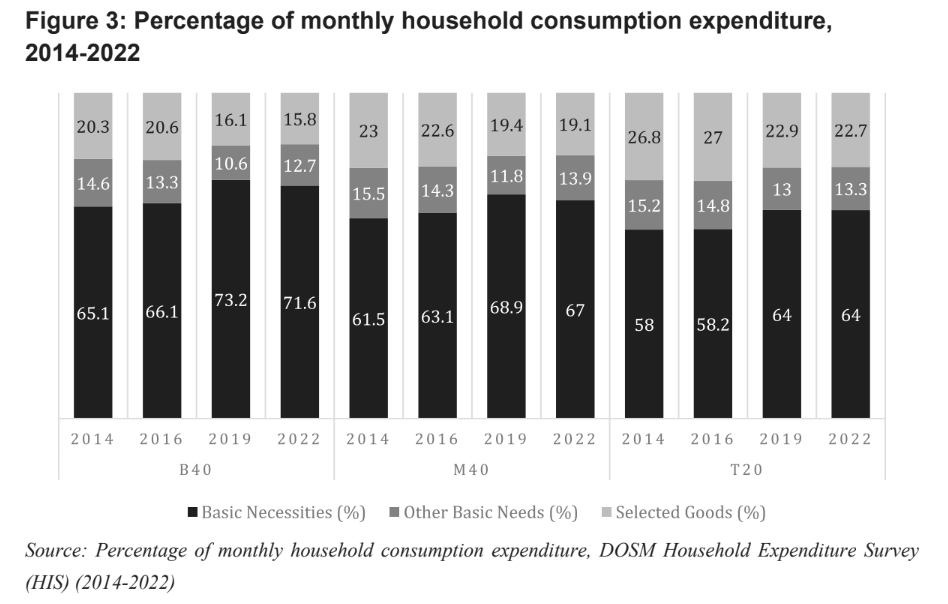
Within the COICOP categories, the DOSM has further classified them into three main goods baskets, which are basic necessities, other basic necessities, and selected goods. Basic necessities comprise categories (1, 4, 7, and 11), covering food, housing, transport, and restaurants; other basic necessities include categories (3, 6, 8, and 10), which refer to clothing, health, communication, and education; while selected goods include alcohol and tobacco (2), furnishings (5), recreation (9), insurance (12),and personal care (13).
Overall, there is an upwards trend across all groups in basic necessities, but a downwards trend for other basic needs and for selected goods. This indicates that regardless of income-group, households are increasingly constrained by the rising cost of living, reallocating their expenditure towards essentials. The impact is most severe for B40 households, whose budgets are overwhelmingly dominated by basic necessities, leaving little room for savings or upward mobility.
Besides, M40 households are increasingly experiencing “middle-class fragility” as they struggle to balance rising necessities with aspirations for higher living standards. While the T20 may have retained greater flexibility in their spending, even they have reduced allocations for discretionary goods. These patterns highlight the widening financial pressures faced by households and underscore the importance of policies aimed at alleviating the burden of essential expenses.
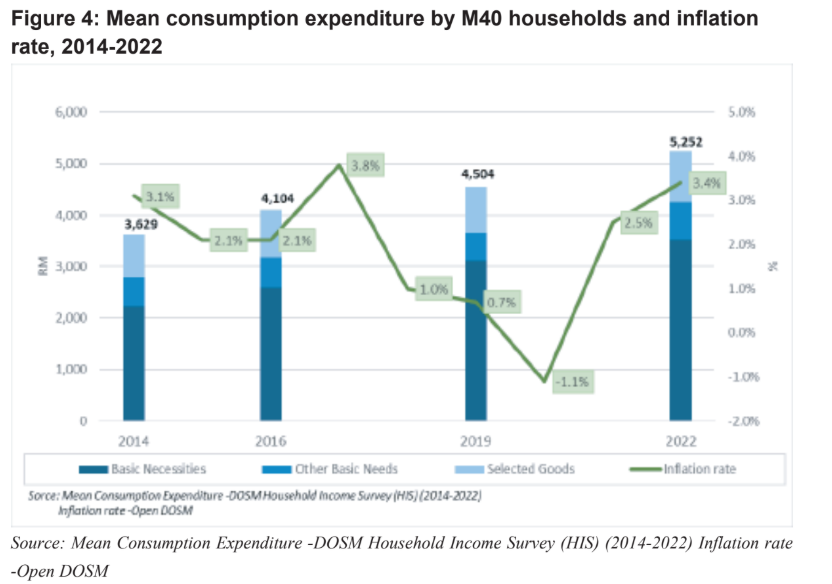
In considering the overall percentage of household consumption expenditure, Figure 4 illustrates the mean of total monthly consumption expenditure for M40 households from 2014 to 2022. It shows a steady upwards trend from RM3,629 in 2014 to RM5,525 in 2022 with the inflation rate fluctuating during the period. In 2016, household expenditure rose slightly, from RM3,629 to RM4,104, showing a steady and healthy increase in line with the stable inflation rate among 2015 and 2016 (2.1%). This suggests that spending growth was driven more by gradual improvements in income and consumption capacity rather than sharp price changes.
In 2018, Malaysia’s inflation rate experienced a sharp decline, falling from 3.8% in 2017 to 1.0% in 2018, before continuing downward to –1.1% in 2020. This trend was likely driven by the abolishment of the Goods and Services Tax (GST) and the reintroduction of the Sales and Services Tax (SST) in September 2018. The decline was broad-based across all major expenditure categories, with the most significant drop observed in the transport basket, which fell from 13.2% in 2017 to 1.5% in 2018—a decrease of 11.7 percentage points. This was followed by personal care, social protection, and miscellaneous goods and services (–2.6%), as well as food and beverages and recreation, sport, and culture, both of which declined by 2.3%. The inflation rate rebounded in 2021, largely driven by post-pandemic phenomena.
Although inflation rates were comparable in 2014 (3.1%) and 2022 (3.4%), household expenditure rose sharply from RM3,629 to RM5,252. This divergence highlights a shift in spending patterns, with rising costs driven not only by prices but also by new essentials such as internet services,smartphones, and digital platforms like e-hailing and food delivery. Additionally, increasing education fees and mounting household debt have further intensified the financial pressures faced by Malaysian households.
6. Conclusion and Recommendations
Malaysia’s middle class, particularly the M40, has expanded in size but remains fragile. Rising household numbers reflect upward transitions, yet income growth has slowed while expenditure has surged due to higher costs of essentials, digital services, education fees, and rising debt. Occupationally, the middle class is concentrated in skilled and semi-skilled work, underscoring both its centrality and vulnerability within the economy.
Policy Recommendations
1. Boost income growth and resilience through productivity-linked wages and industrial upgrading.
2. Strengthen social protection by expanding healthcare, unemployment coverage, and retirement savings.
3. Address cost of living pressures via affordable housing, regulation of education fees, and targeted relief for middle-income households.
4. Adopt dual frameworks that combine income (B40/M40/T20) with occupational classification for more precise policymaking.
5. Promote upward mobility by investing in STEM, AI, and vocational skills to enable transitions into higher-value occupations.
In sum, strengthening the resilience of the middle class is vital for Malaysia’s socioeconomic stability and for growth out of the middle-income trap.
References
Alan, R. (n.d.). Bourgeoisie. Encyclopedia Britannica. https://www.britannica.com/topic/bourgeoisie
Andrianjaka, R. R. (2017). The expanding middle class in developing countries: Current trends and future projections (ADBI Working Paper No. 753). Asian Development Bank. https://www.adb.org/sites/default/files/publication/325056/adbi-wp753.pdf
Banerjee, A. V., & Duflo, E. (2008). What is middle class about the middle classes around the world? Journal of Economic Perspectives, 22(2), 3–28. https://pubs.aeaweb.org/doi/pdfplus/10.1257/jep.22.2.3
Bonnet, A., & Kolev, A. (n.d.). The middle class in emerging Asia: Champions for more inclusive societies? OECD Development Centre Working Paper.
Department of Statistics Malaysia (DOSM) (2017). Household income and basic amenities survey report, Malaysia, 2016.
Department of Statistics Malaysia (DOSM) (2020). Household income and basic amenities survey report, Malaysia, 2019.
Department of Statistics Malaysia (DOSM) (2023). Household income and basic amenities survey report, Malaysia, 2022.
Department of Statistics Malaysia (DOSM) (2024). Salaries & Wages Survey Report Malaysia 2024.
Easterly, W. (2001, July). The middle class consensus and economic development. National Bureau of Economic Research. https://users.nber.org/~confer/2001/si2001/easterly.pdf
Eichengreen, B., Donghyun, P., & Kwanho, S. (1999). Changes in the wage structure and earnings inequality. National Bureau of Economic Research. https://www.nber.org/system/files/working_papers/w18673/w18673.pdf
Fitrawaty, Maipita, I., Hermawan, W., & Rahman, H. (2021). The impact of middle-class towards economic growth and income inequality in Indonesia. Jurnal Ekonomi Malaysia, 52(3), 3–16. https://www.ukm.my/jem/wp-content/uploads/2021/06/jeko_523-1.pdf
Gregory, H. W. S., & Ismail, S. (2007). Searching for the poor and middle(s) (Working Paper No. I-20). Khazanah Research Institute (KRI). https://cdn.prod.website-files.com/684b55df28cddcbe52b406f2/68b7ec8242ff9f491ac058e8_68b65d1fc3bbcd227d8031a3_Working-20Paper-20I-20–20Searching-20for-20the-20poor-20and-20middle-20(s)-20final.pdf
Hisnanick, J. J. (2012). The income dynamics of U.S. middle class households from the mid-1990s to 2012. Program Participation and Income Transfer Branch, Social, Economic and Housing Statistics Division, U.S. Census Bureau.
Institute for Policy and Social Analysis (IPASA). (2008). The growth report: Strategies for sustained growth and inclusive development. https://ipasa.co.za/Downloads/Policy%20and%20Reports%20-%20Economic%20and%20Industrial/Aug%2008%20GrowthReportComplete.pdf
Jenny, L. (2025). Household income classification in Malaysia: Understanding B40, M40 and T20 in 2025. HousingWatch.my. https://www.housingwatch.my/property/what-is-b40-m40-and-t20-in-malaysia-understanding-income-levels-in-2025
Jun, S. W. (2024, March 19). PM Anwar: Malaysia’s household debt at RM1.53t as of last year. Malay Mail. https://www.malaymail.com/news/malaysia/2024/03/19/pm-anwar-malaysias-household-debt-at-rm153t-as-of-last-year/124218
Kenneth, T. (2023, September 21). Survey: Majority of urban M40 confident of retiring comfortably, but in reality savings likely to be depleted soon. Malay Mail. https://www.malaymail.com/news/malaysia/2023/09/21/survey-majority-of-urban-m40-confident-of-retiring-comfortably-but-in-reality-savings-likely-to-be-depleted-soon/92001
Kharas, H. (2019). Under pressure: The squeezed middle class. Organisation for Economic Co-operation and Development (OECD). https://www.oecd.org/en/publications/under-pressure-the-squeezed-middle-class_689afed1-en/full-report.html
Kharas, H., & Gertz, G. (2010). The new global middle class: A cross-over from West to East. Wolfensohn Center for Development at Brookings, 1–14.
Malay Mail. (2022, June 27). Finance minister: Bantuan Keluarga Malaysia cash aid totalling RM8b is largest in country’s history. Malay Mail. https://www.malaymail.com/news/malaysia/2022/06/27/finance-minister-bantuan-keluarga-malaysia-cash-aid-totalling-rm8b-is-largest-in-countrys-history/14476
Malay Mail. (2025, January 17). What is Malaysia’s biggest risks as we go into 2025? WEF study says economic downturn top of list. Malay Mail. https://www.malaymail.com/news/malaysia/2025/01/17/what-is-malaysias-biggest-risks-as-we-go-into-2025-wef-study-says-economic-downturn-top-of-list/163430
Mansor, N., & Rabi, A. (2013). National social wellbeing blueprint. University of Malaya Social Wellbeing Research Centre (SWRC). https://swrc.um.edu.my/img/files/National%20Social%20Wellbeing%20Blueprint.pdf
Milanovic, B., & Yitzhaki, S. (2002, June). Decomposing world income distribution: Does the world have a middle class? Review of Income and Wealth, 48(2), 155–181. https://www.roiw.org/2002/155.pdf
Ministry of Finance Malaysia (2020, November 6). Budget 2021: BSH to be replaced with BPR, RM6.5 bln to benefit 8.1 mln people. Bernama. https://www.mof.gov.my/portal/arkib/press/MR2020/Nov/mr061120(4).pdf
Organisation for Economic Co-operation and Development (OECD) (2010). The emerging middle class in developing countries. OECD.https://cooperative-individualism.org/thurow-lester_a-surge-in-inequality-1987-may.pdf
World Bank (2006). World development report 2006: Equity and development. World Bank Publications. https://documents1.worldbank.org/curated/en/435331468127174418/pdf/322040World0Development0Report02006.pdf
World Bank (n.d.). World Bank country and lending groups. World Bank Publications. https://datahelpdesk.worldbank.org/knowledgebase/articles/906519-world-bank-country-and-lending-groups
You might also like:
![Tracking Malaysia’s Development Expenditure in Federal Budgets from 2004 to 2018]()
Tracking Malaysia’s Development Expenditure in Federal Budgets from 2004 to 2018
![Installing a Facial Recognition System at Penang Airport: A Necessary Step to Ease Travel Protocols]()
Installing a Facial Recognition System at Penang Airport: A Necessary Step to Ease Travel Protocols
![Penang's Economy is Healthy and Strong, with Incomes Rising and Inequality Decreasing]()
Penang's Economy is Healthy and Strong, with Incomes Rising and Inequality Decreasing
![The Covid-19 Disruption Highlights the Neglected Nature of Arts and Culture Sector in Malaysia]()
The Covid-19 Disruption Highlights the Neglected Nature of Arts and Culture Sector in Malaysia
![ESG Disclosures among Public-listed Companies Based in Penang]()
ESG Disclosures among Public-listed Companies Based in Penang