Executive Summary
- Quick conclusions that Penang is “troubled” simply based on statistics about mean monthly salaries and wages and their associated growth rates miss out on the bigger picture
- Penang’s economy is a prominently inclusive one that for example, emphasises female participation
- Lower than expected salaries and wages are also explained by Penang’s equitable economic environment where both the poor and rich benefit – the poor are not left behind while the rich are given space to earn economic returns. Penang’s economic environment is also equitable enough to accommodate both the less-educated and highly educated
- Deep-seated economic structures of the states are identified to cause highly erratic trends in the mean monthly salaries and wages. This will be detrimental to the states in an environment with a weak de-centralisation of authority
- Policy narratives need to move beyond petty intra-state competition that will ultimately jeopardise the national economy as a whole
Introduction
On May 5, 2017 the Department of Statistics (DoS) published the Salaries & Wages Survey Report for the year 2016. The report highlighted an overall 6.3% annual growth rate in the mean monthly salaries and wages (SnW) from 2015, including a 6.4% and 6.2% growth in SnW for males and females, and a 5.7% and 4.7% growth for urban and rural employees respectively.
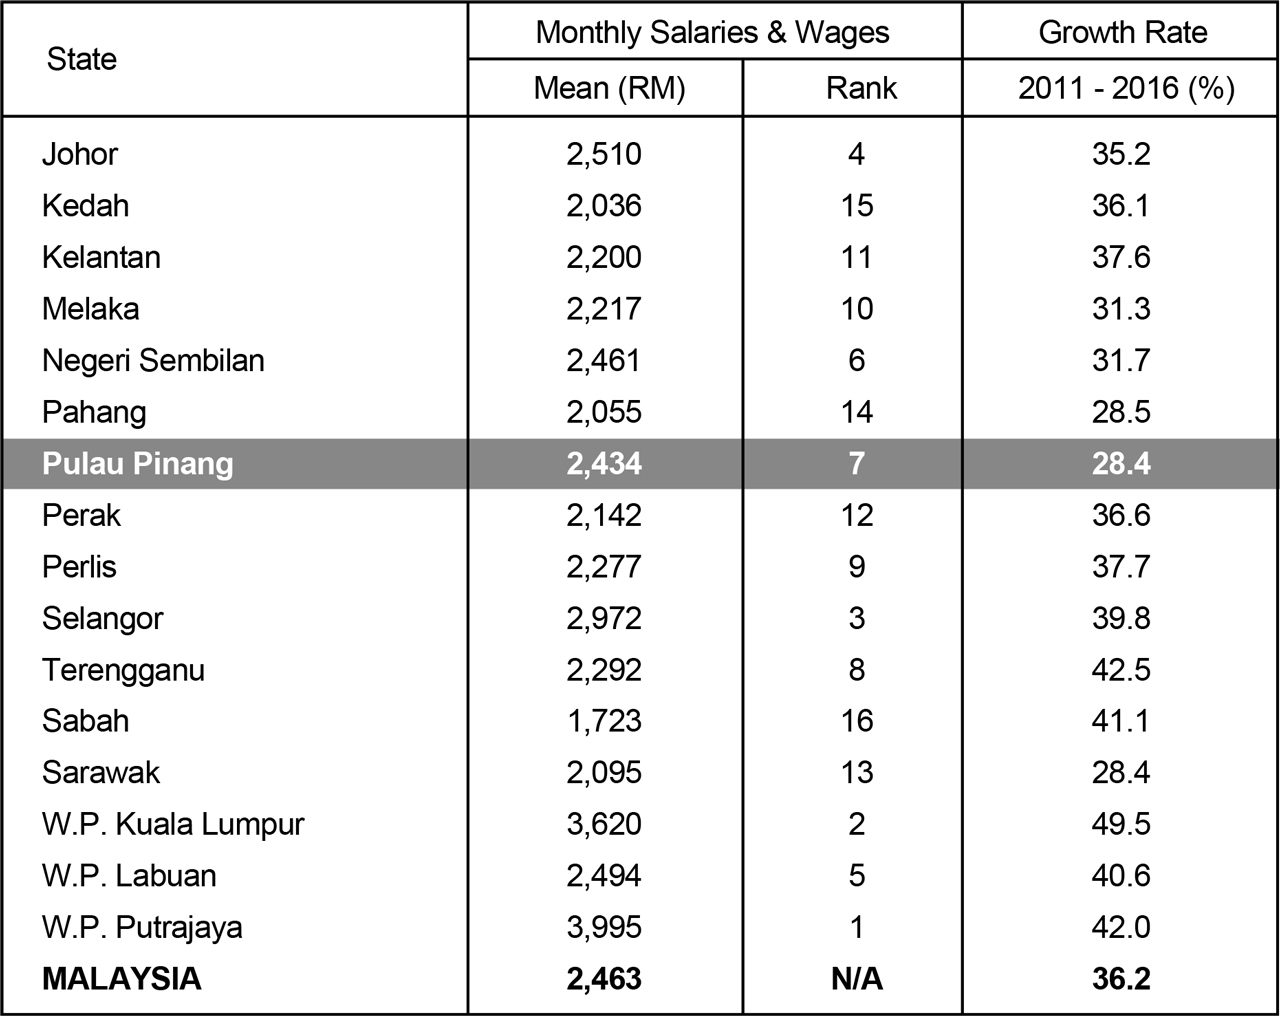
As is often the case, statistical releases by the DoS are a source of anticipation for various stakeholders – alternative data sources are few and far between – because they serve to illuminate how the country is faring. While data can generally be a source for evidence-based policy making, they can equally be a source for erroneous comparisons and conclusions if not properly studied. This happens to be the case for Penang in the above mentioned report. The data indicated that in 2016, Penang ranked 7th in the mean monthly salaries and wages at RM2,434 – lower than the national average, and was surprisingly outperformed by Negeri Sembilan, for example.[1]
Salary and wage-growth rates paint an even more morbid picture. Between 2011 and 2016, the average income for Penangites only saw a 28.4% growth, a meagre amount given that states like Terengganu and Kelantan saw growth rates of 42.5% and 37.6% respectively during the same period (Table 1). When observed superficially, these figures appear to suggest that Penang is in a “troubled” position. Taking this erroneous conclusion one step further, one could even speculate reasons for it being so – high unemployment rates, shortage of jobs etc.
These conclusions, however, discount the intricacies of the subject matter and fall far short of a holistic assessment of a situation. At best, such convenient conclusions are myopic, and at worst, a fallacy altogether. Christopher Hitchens, the late Anglo-American author, fittingly quoted: “The usual duty of the ‘intellectual’ is to argue for complexity and to insist that phenomena in the world of ideas should not be sloganized or reduced to easily repeated formulae”.
This brief sheds some light on why the salaries and wages in Penang appear to be below expectations. It will also attempt to deduce a holistic conclusion to determine if Penang is indeed “troubled”.
Table 1: Monthly Salaries & Wages of Employees, 2016 and Growth Rate, 2011 – 2016
Supporting Our Weakest Link
Placing 7th in the average monthly salaries and wages does not look good for Penang. However, a thorough understanding of what factors were included, or more importantly, excluded – which happens to be a great deal – precedes the aforementioned conclusion.
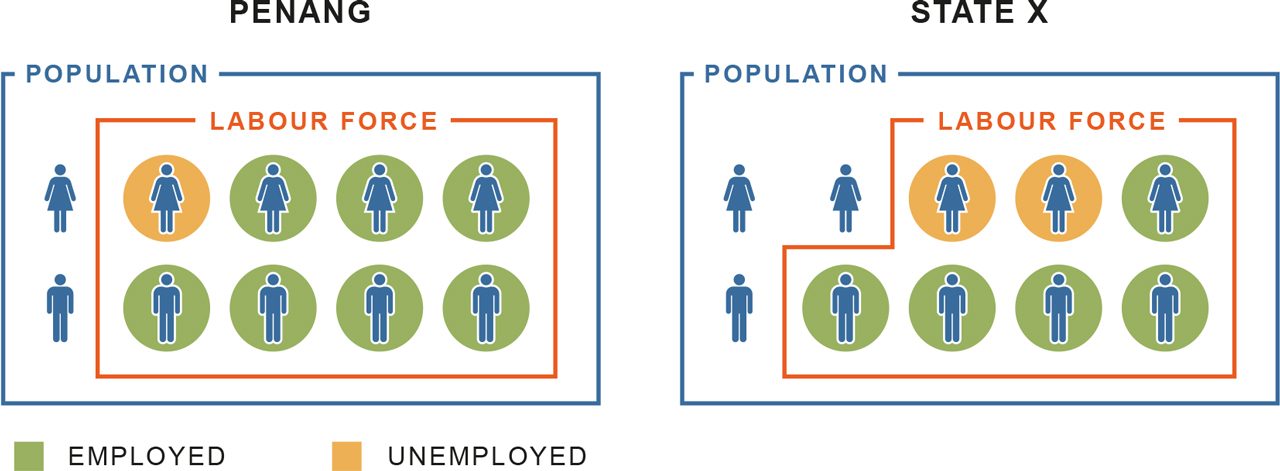
An average monthly salary of RM2,434 tells us that on average, all employed persons earn RM2,434 per month. But this tells us very little about the bigger picture. If anything, an average monthly salary reveals more of what we do not know rather than what we do know. As illustrated in Figure 1, employed persons are merely a subset of the labour force, which is in itself a subset of the total population. The average monthly salary therefore tells us nothing about the condition of those who are unemployed in the labour force, and in the wider population at large, which is an important measure of inclusiveness. In addition, the average monthly salary also fails to indicate if there is a wage gap between the lowest and highest wage earners, which is an important measure of equity.
Understanding what were accounted for in the average monthly salary indicator is crucial not only to ensure that apples are being compared to apples, but also because what were accounted – or not accounted for – affect the value of the indicator. I discuss two such instances below.
Figure 1: Graphic Illustration of Population, Labour Force, Employed and Unemployed Persons
Definition:
Population – All persons present in the country.
Labour Force – Population in the working age group of 15 to 64 years who are either employed or unemployed.
Employed Persons – All persons who work at least one hour for pay, profit, or family gain either as an employer, employee, own-account worker, or unpaid family worker.
Unemployed Persons – All persons who are either actively unemployed (available for work and are actively looking for work) or inactively unemployed (not actively looking for work).
1. The Case of Women Participation: An Inclusive Penang
It is globally acknowledged that gender inequality in employment is detrimental to the economy for a variety of reasons. The International Labour Organisation (ILO) reports that women are consistently disadvantaged at every level: employment opportunities, quality of jobs and salaries (ILO, 2016). Sadly, Malaysia is reflective of this. The data obtained from the Salaries and Wages Survey Report 2016 record that males earn a monthly average of RM527.9 more than their female counterparts. This gap is persistent in all types of occupation, more so among professionals and managers where males earn RM1,250 and RM890 more respectively. Relating the gender wage gap to the average monthly salary, females are therefore a source of negative bias toward the average monthly salary. With this, I put forward two propositions:
Proposition 1: Lower Labour Force Participation Rate (LFPR) among females will artificially inflate the average monthly salary ranking, ceteris peribus.
Proposition 2: Higher female unemployment rate will artificially inflate the average monthly salary ranking, ceteris peribus.
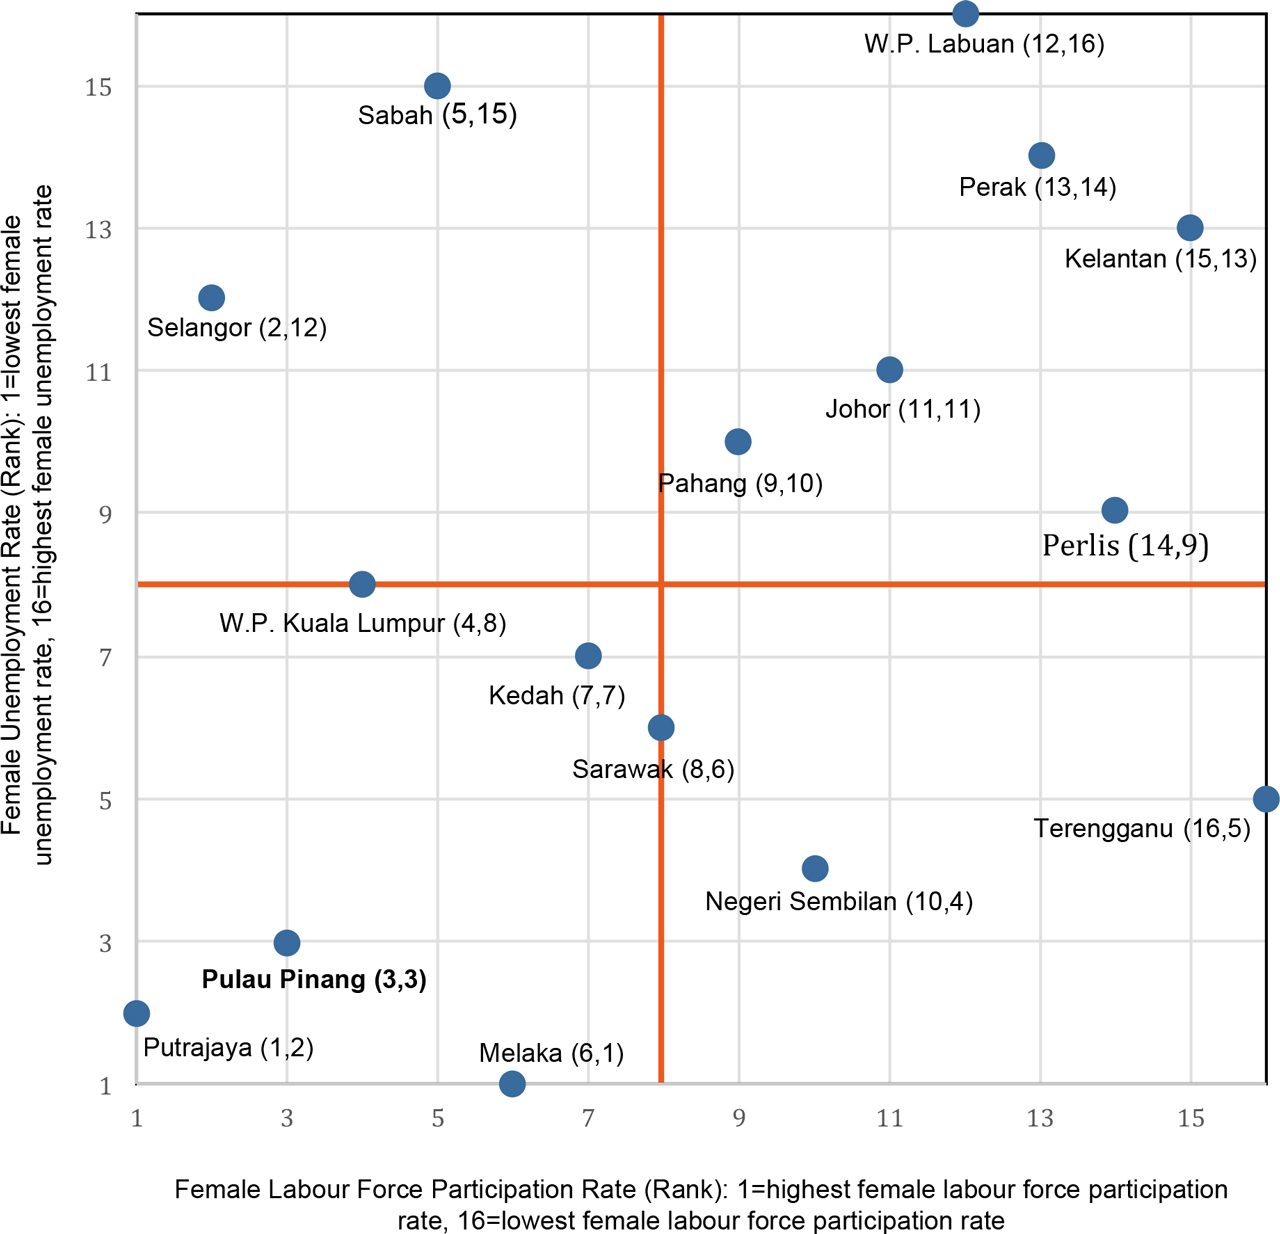
In turn, these two propositions may adopt a dynamic relationship that is able to influence the average monthly salary ranking as graphically illustrated in Box 1. Put simply, a state with a higher female LFPR and a lower female unemployment rate will score lower in the average monthly salary in comparison to a state with a lower female LFPR and a higher female unemployment rate. Coincidentally, Penang reflects the former.[2] Figure 3 evidences a higher female LFPR and a lower female unemployment rate in Penang than most states. This, in part, explains some variations in the average monthly salary. Penang scored below expectations because it is more inclusive of females in the workforce in comparison to other states.[2] It can be further argued here that between a choice of (a) higher average monthly salary and greater gender discrimination or (b) lower average monthly salary and greater gender equality, an inclusive government will choose the former; one which is clearly the choice of the Penang state government.
Box 1: Graphic Illustration of Proposition
Assuming Penang and a representative State X has an equal population of 5 males and 5 females. Assume further that whereby the males earn RM10 while the females earn RM5.
The figure above shows that 4 out of 5 females in Penang are in the labour force, indicating a higher female LFPR in comparison to State X which has only 3 out of 5 females participating in the labour force. In Penang, it is also observed that 3 out of 4 females in the labour force are employed, indicating a lower female unemployment rate than State X with only 1 out of 4 females in the labour force being employed.
Holding everything else constant, the average wage can be calculated, the result of which shows a lower average wage for Penang because it is more inclusive of females.
Figure 3: The Ranking of States by Female Labour Force Participation Rate and Female Unemployment Rate, Malaysia, 2016
Source: Department of Statistics, Malaysia and Author’s Own Calculations
2. A Case of Wealth Distribution: Equitable Penang
It is commonly debated among economists that perfect equality and efficiency cannot co-exist because one is a trade-off of the other. What can be agreed on however is that a combination of both is needed for sustainable economic growth. To use the metaphor of an economic pie, sustainable growth is such that (a) the pie is expanding and (b) the pie is shared out more fairly. Two indicators are of relevance here:
Indicator 1: GDP per capita – where a higher value indicates an expanding pie; or in other words, economic growth
Indicator 2: Employment rate – where a higher employment rate indicates greater distribution of economic benefits by way of returns to labour through salaries and wages
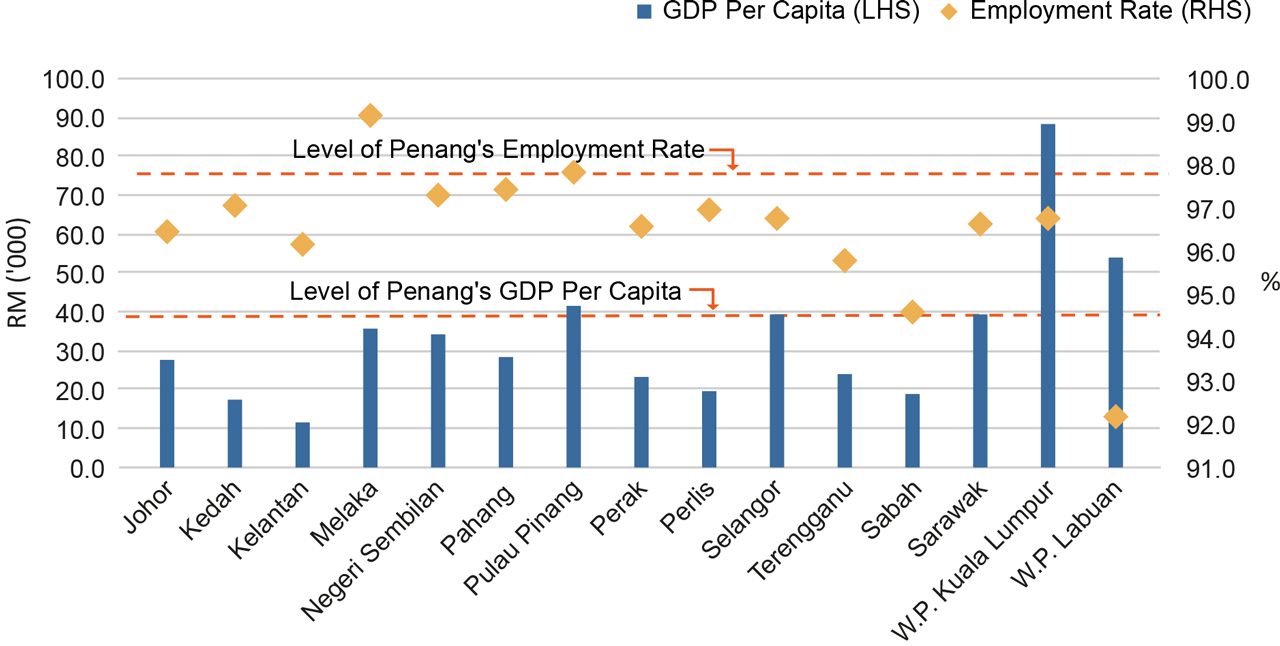
By studying the data for these two indicators, Penang is observed to be in the lead for both GDP per capita and employment rate (Figure 4). Relating this to the wages then, Penang as an economy has higher GDP per capita and employment rate, as well as lower wages, relative to the other Malaysian states. To perform an objective assessment of Penang’s presumably poor 7th place ranking in the Salaries and Wages Survey Report 2016, it is instructive to toy with polarities, i.e. is Penang better off than a state with higher wages but lower GDP per capita, and lower employment rates?
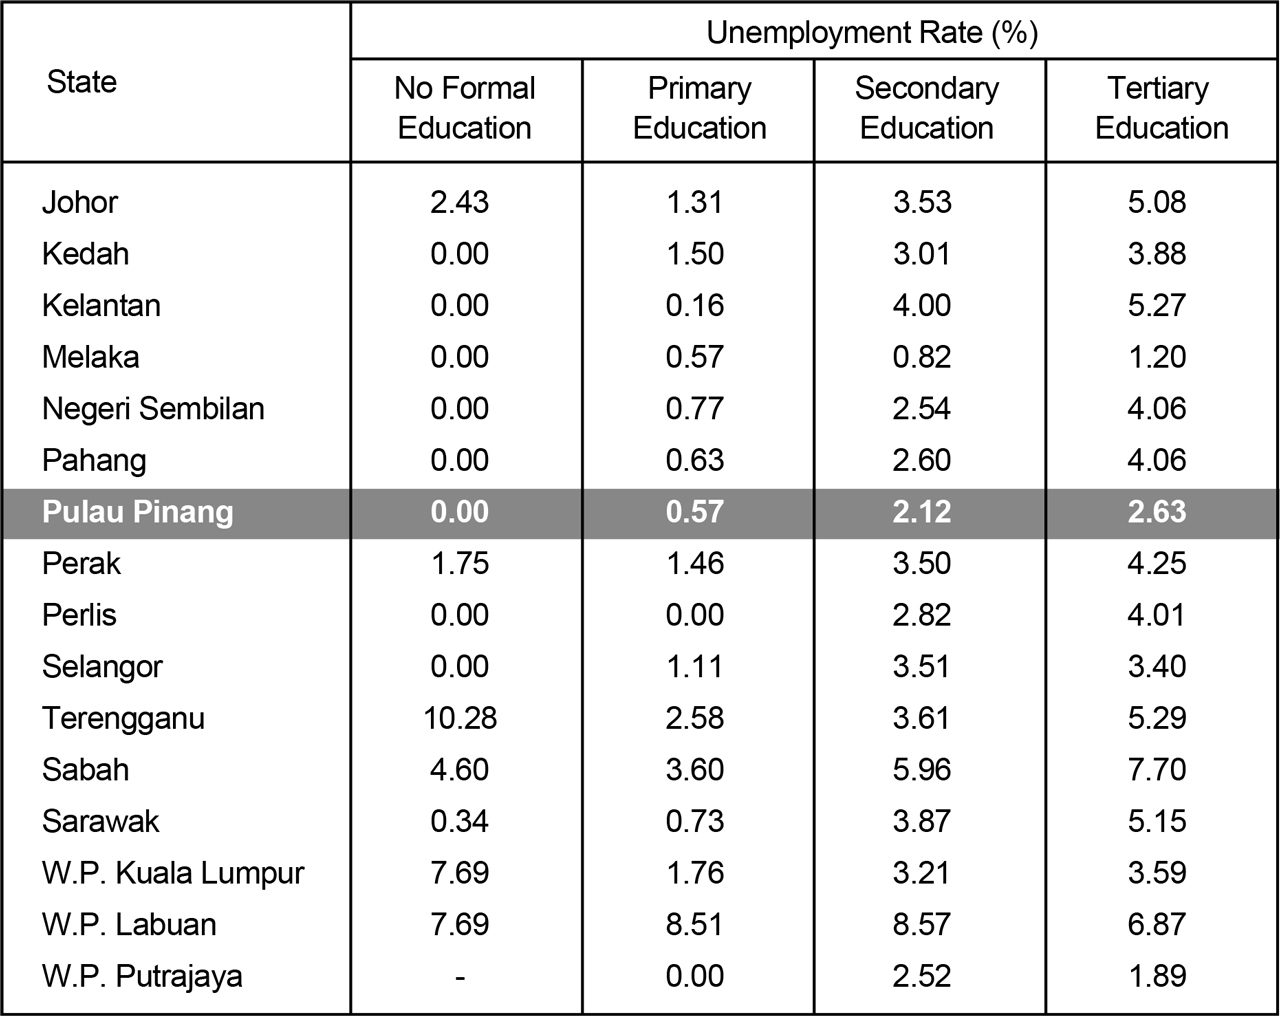
From a sustainable growth perspective, the answer is yes. An economy reflective of the above mentioned polarity would experience great inequality because while only a few people have jobs (commonly a minority group of economic elites), they are compensated with high wages despite a sluggish economy. A closer look at the unemployment rates further highlights this point. In addition to achieving lower unemployment rates across all education levels, Penang performs starkly better for those with secondary and tertiary education relative to the other states (Table 2). This goes to show that Penang’s economic environment is equitable enough to accommodate both the less-educated and highly educated.[3] With respect to striking a balanced combination for sustainable growth, it can be concluded that Penang is progressing well, albeit having comparatively more room for improvement.
Figure 4: GDP Per Capita and Employment Rate by State
1. W.P. Kuala Lumpur includes W.P. Putrajaya.
2. GDP Per Capita is for year 2015; the latest publicly available data.
3. Employment Rate is for year 2016.
Source: Department of Statistics, Malaysia and Author’s Own Calculations.
Table 2: Unemployment Rate by Highest Education Attainment and State, Malaysia, 2016
The case of women participation and wealth distribution is illustrative of the complexity associated with the forming of conclusions on economic conditions based solely on the average monthly wage rankings. As argued, lower wages – relative to other states – need not be indicative of a “troubled” economy, but rather, of an inclusive and equitable one.
Some Structural Considerations
The conspicuous trend in the growth rate of SnW begs for further analysis. Between 2012 and 2016, the growth rate of wages by the states displayed highly erratic trends (Table 3). In 2014 for example, Penang recorded a 13.59% growth rate in average wages, but documented only a 3.28% growth the following year. Perlis, on the other hand, recorded a staggering 23.32% growth in 2014, but reported only an 8.32% growth in 2015, and a further drop of 1.65% in 2016. To put this into perspective, an archetypal Perlisian drawing a monthly salary of RM2,000 will see his monthly salary increase by RM460 in 2014, but only RM160 in 2015, and a mere RM40 in 2016. This trend of intense fluctuation is worrying because it proves to be a source of great economic uncertainty and more worryingly, it appears to be commonplace across most states and time periods, instead of being an outlier.[4]
Table 3: Annual Growth Rate in Average Monthly Salaries and Wages by State, Malaysia

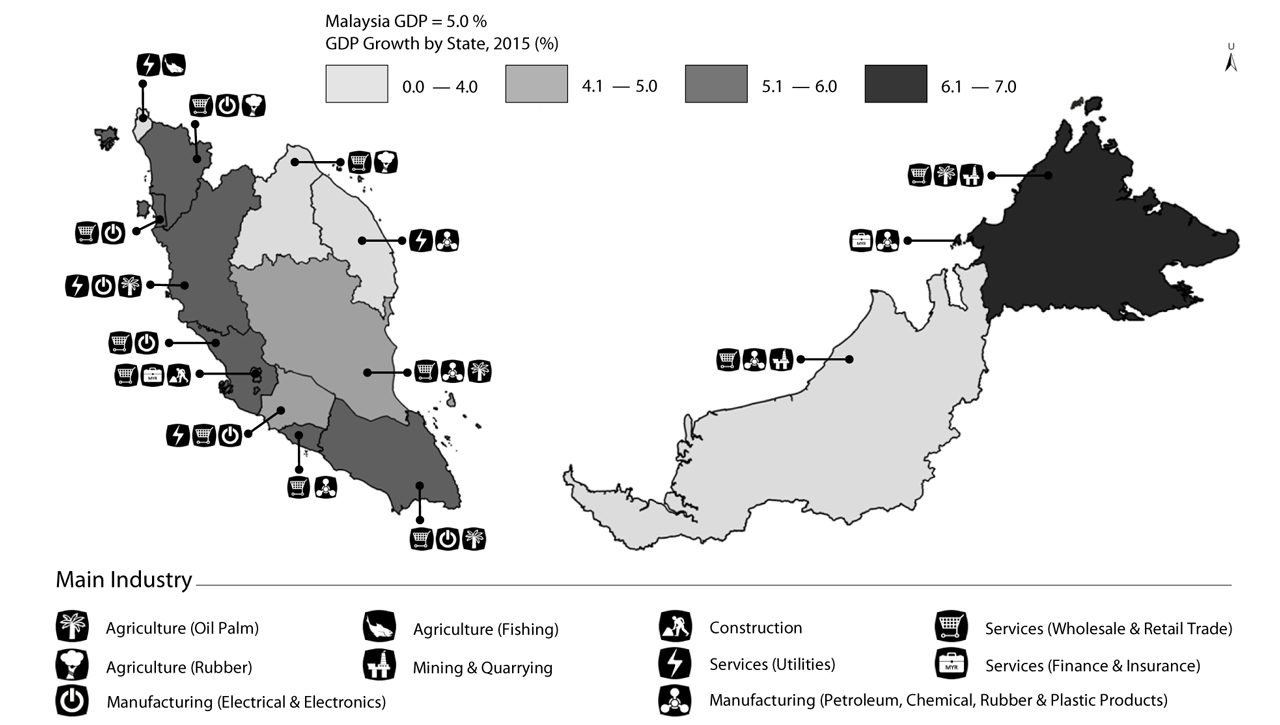
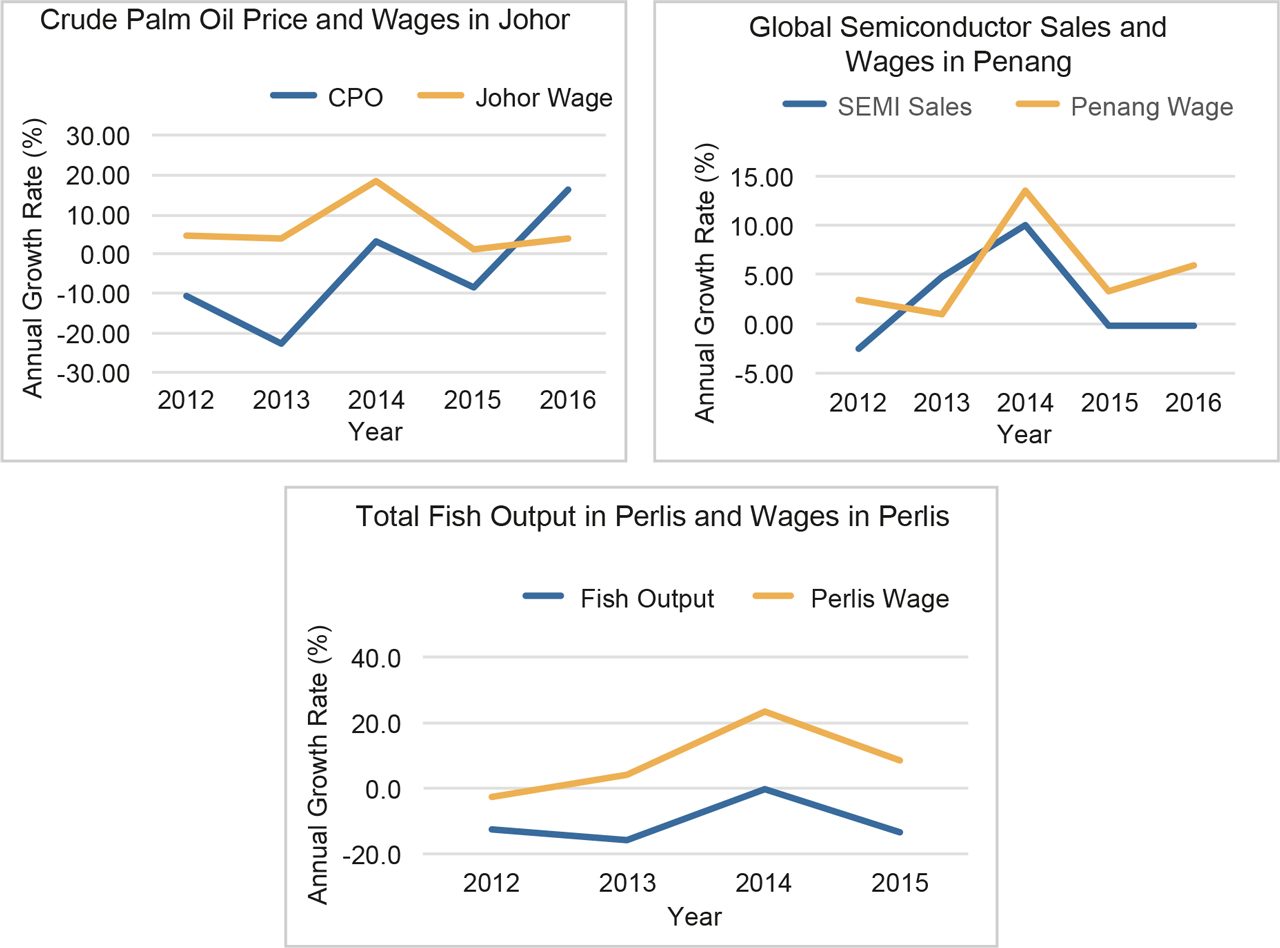
A source of bias which may contribute to this erratic trend is the deep-seated economic structure of the states. Figure 5 is reflective of this. It should not come as a shock to learn that Penang’s main industry is in electrical and electronics manufacturing, or that Sarawak’s is in petroleum manufacturing and mining. While this is not necessarily a stumbling block to Malaysia’s economic growth, an over-reliance on certain industries by individual states may well be a structural concern for long-term growth. This is shown to be the case with wages. One might expect movements in the average monthly salaries and wages by the states to be rather distant from industry-specific shocks because the data are aggregated across multiple dimensions – firm size, business focus, industry participation, employee position etc. An over-reliance of the states on specific industries however will cause state-wide wages to fluctuate with their respective industry developments because there is little room for diversifying risks. Figure 6 is indicative of this. Given that Perlis has fishing as its main industry, it can be seen that the drastic fluctuation in wages closely mirrors trends in fisheries output. As the second largest producer, on average, of crude palm oil (CPO) in Malaysia, Johor experiences wage fluctuation according to CPO prices.[5] Likewise, Penang’s extreme wage fluctuation in 2014 and 2015 mirrored the trend in global semi-conductor sales.
Figure 5: GDP Growth Rate and Main Industry by State, Malaysia, 2015
It has to be emphasised here that having states specialise in specific industries is an advantage to the Malaysian economy. Specialisation produces agglomeration forces that are
Figure 6: Annual Growth Rate in Main Industry Indicator and Annual Growth Rate of Salaries and Wages
It has to be emphasised here that having states specialise in specific industries is an advantage to the Malaysian economy. Specialisation produces agglomeration forces that are self-re-enforcing. A state that specialises in an industry – all else being equal – will enjoy greater industry-specific economic activity which will then attract more firms and economic activity. These firms will then become new customers who will then attract more firms. This circular causality is often argued to be more efficient in the allocation of resources, to bring about greater economies of scale, as well as greater innovation. These will ultimately prove beneficial to the national economy.
The same however cannot be said for the states. Specialisation in specific industries by the states have resulted in an over-reliance on them, so much so that the salaries and wages are highly susceptible to the developments of that particular industry. The states are therefore directly exposed to industry fluctuations – both headwinds and tailwinds – which then becomes a cause for concern because Malaysia is characterised by a strong centralisation of authority by the federal government. This goes to show that state governments consequently find themselves lacking the necessary authority to respond against industry developments that directly affect them. This is made worse when a federal government practices unfair allocation of resources, especially when coupled with policies that re-enforces industrial agglomeration. The experience of Penang as narrated in Box 2 is instructive.
BOX 2: Penang’s Experience with Agglomeration in the Absence of De-centralisation of Authority
Penang’s success in the electric and electronic (E&E) industry has been recognised, evidenced by the growing myriad of both multinational and domestic companies from the industry. Given that E&E makes up a major portion of Malaysia’s exports, both the state and federal governments have put in place policies which re-enforce agglomeration in order to develop the industry further, ultimately benefiting from the economic benefits it produces. The state government for example has developed a number of industrial parks that encourage geographical agglomeration and provide skills training to ensure a constant supply of industry-ready human capital. Likewise, the federal government is also actively promoting Malaysia as an investment destination for high-tech manufacturing by offering various incentives.
Penang however is, in some sense, a victim of its own success. A robust economic environment has resulted in higher population density. The Migration Survey Report 2016 recorded Penang as having the highest positive effectiveness ratio of migration between 2015 and 2016. This brought with it the demand for affordable housing. While the responsibility for affordable housing is shared between the state and federal governments, Penang has recorded the lowest number of Program Perumahan Rakyat projects of any state in the country, and as of May 2017, not a single 1Malaysia People’s Housing Project has been built – both of which are initiatives of the federal government. Despite this, the Penang state government has since stepped in to provide state-funded affordable housing. But this has not been successful in resolving the issue as the state governments in Malaysia have limited authority to raise their own revenues. Therefore, Penang is caught in a limbo between the need to further grow its industries, but lacking the authority to address the challenges that come with said growth.
Some Final Thoughts
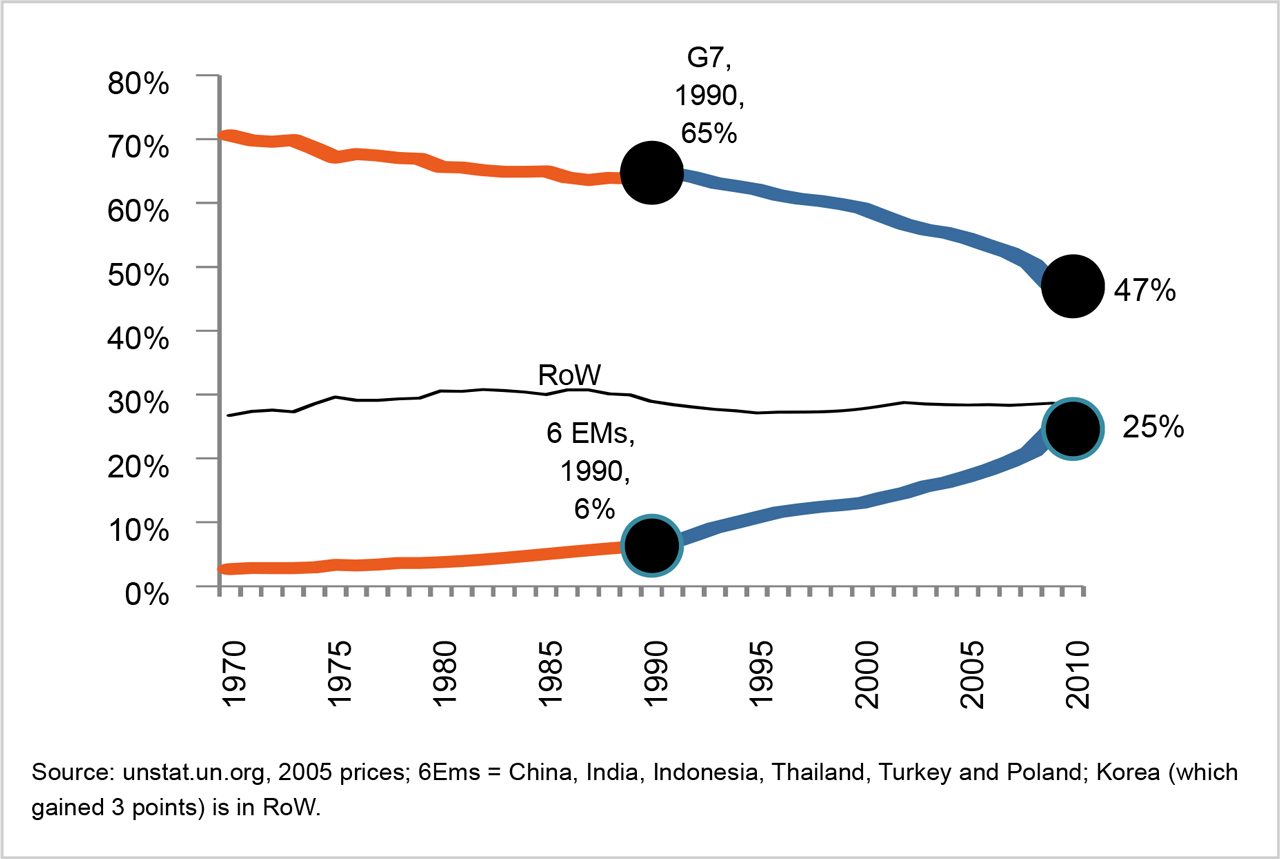
In the introduction, the possibility of raising the alarm was mentioned because Penang only saw a 28.4% growth in wages between 2011 and 2016 while Terengganu and Kelantan saw growth rates of 42.5% and 37.6% respectively during the same period. It should be recognised however that these figures are an organic development of economic growth. The radical replacement in G7 shares of global manufacturing GDP by emerging economies in the 1990s is an example of this (Figure 7). The rationale behind this is simple.
The catch-up by poorer economies often requires a trade-off by wealthier economies, commonly through a slower growth, but a growth nonetheless. It is therefore proper to see and expect higher wage growth in Terengganu and Kelantan as an indicator of Malaysia’s economic growth as a whole. That said, the policy narratives have to move beyond in-house state competition. Economic competition in today’s globalised landscape has moved beyond national borders; taking place instead on a regional and global frontier. The catch-up of poorer states and the continual growth of wealthier ones, albeit having to be managed so as to not elevate inequality concerns, are ultimately collectively beneficial for every state in the long run. The real competition after all is not characterised as “Penang vs. State X”, but rather as “Malaysia vs. Country X”, or as “ASEAN vs. Region X”, or even as “Pax Americana vs. Pax Sinica”.
Figure 7: G7 Share of Global Manufacturing GDP
Concluding Remarks
The underlying narrative of trade-offs is evident throughout this brief. Lower wages for a more gender inclusive workforce; smaller individual-share of economic gains for a more equitable society; benefits from industrial agglomeration for greater de-centralisation of power to states; and economic catch up in poorer states for tapered growth in wealthier ones. The matrix for evaluation is therefore “to what extend is a trade-off beneficial?”, or rather “what combination of each be set as a goal?”, and not whether a 7th place ranking in the monthly salaries and wages by the states and a 28.4% growth rate from 2011 to 2016 is troubling or not; hence, the argument for complexity. With these considerations as the backdrop, Penang’s lower than expected wages bring to light the state’s more inclusive and equitable economy. More than that, it calls to attention the need for de-centralisation as a mechanism to manage the effects of a deep-seated state economic structure that is re-enforced by industrial agglomeration forces. The end game of managing these trade-offs however should move beyond the trivial “I-beat-you” squabble between states and toward a collective means to prepare Malaysia to take on the new wave of digital globalisation.
Bibliography
Baldwin, R. (2011). Trade and Industrialisation After Globalisation’s 2nd Unbundling: How Building and Joining a Supply Chain are Different and Why it Matters. National Bureau of Economic Research.
ILO (2016). Women at Work. Geneva: International Labour Office.
[1] The mean monthly salaries and wages (SnW) is used interchangeably with average monthly salaries, monthly salaries, and monthly wages.
[2] At the forefront of championing gender equality in Penang is the Penang Women’s Development Corporation (PWDC) which is funded by the Penang state government. It has to be acknowledged that this success largely stems from PWDC’s active advocacy in shifting toward a female inclusive narrative both in policy making and the public sphere through their programmes.
[3] An equitable distribution of economic benefits is rarely naturally occurring. Rather, it takes deliberate efforts by the Penang state government to ensure that the poor are not left behind through re-distribution, without stifling the economic returns of capital owners.
[4] Erratic fluctuations in salaries and wages may effect private consumption. For example, an individual will not have the confidence to purchase a vehicle if his or her wages fluctuate drastically. In the same way, businesses are also unable to make long-term decisions under such volatile cost structures. These leads to economic uncertainty.
[5] From 2010 to 2012, Johor was the second largest producer of CPO behind Sabah. From 2013 to 2015, Johor ranked third behind Sarawak.
Managing Editor: Ooi Kee Beng Editorial Team: Regina Hoo, Lim Su Lin, Nur Fitriah, Ong Wooi Leng
You might also like:
![Food and Nutrition Security for Urban Low-income Households in Penang]()
Food and Nutrition Security for Urban Low-income Households in Penang
![Urgent Need to Strengthen Malaysia’s Legal Framework Against AI-Driven Scams]()
Urgent Need to Strengthen Malaysia’s Legal Framework Against AI-Driven Scams
![Imagine an Education Hub: Leveraging Penang’s International School Ecosystem]()
Imagine an Education Hub: Leveraging Penang’s International School Ecosystem
![Heritage Tourism in George Town: A Complicated and Always Controversial Issue]()
Heritage Tourism in George Town: A Complicated and Always Controversial Issue
![Stringent MM2H Requirements Mar Malaysia’s Record as Preferred Destination for Long-term Residence]()
Stringent MM2H Requirements Mar Malaysia’s Record as Preferred Destination for Long-term Residence


