Executive Summary
- Malaysia’s Development Expenditure (DE) in the Federal Budget stagnated in absolute terms and decreased in percentage terms, during former Prime Minister Najib Razak’s tenure as Finance Minister from 2009 to 2018
- As a country that is still in the process of development and which has yet to achieve the status of a high-income nation, Malaysia still requires significant public investment in infrastructure; from roads and rails, to schools and hospitals
- Over the last 10 years, therefore, to what extent did the stagnation in DE affect the building of public infrastructure in Malaysia? How did the composition of DE change over the past decade? Were some ministries prioritised over others? Which expenditure items in particular were prioritised? Which were neglected? To what extent was DE diverted to “off-budget” items?
- The aim of this analysis is to answer some of these questions and, in doing so, shed light on the tactics that were employed by the ruling Barisan Nasional (BN) coalition in its DE strategy for Malaysia, and hint at some guidelines for how this negative state of affairs can be changed
Introduction
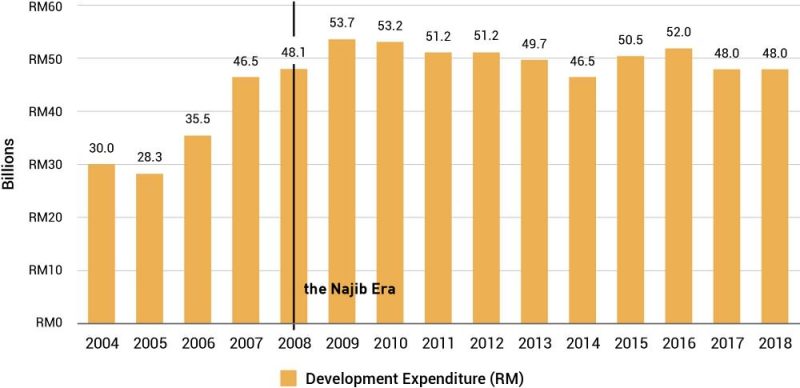
Budget 2018, tabled by then-Prime Minister Najib Razak in his capacity as Finance Minister in Parliament on October 27, 2017, saw RM48bil allocated towards development expenditure (DE). This figure, while equivalent in an absolute amount to its 2017 allocation, and inclusive of a RM2bil provision for contingencies, represented the lowest share that DE had taken of the Federal Budget since Independence in 1957. Both the absolute amount and the budget share of DE had been on a downward trend since Najib became the Finance Minister in 2008 and took office as Prime Minister in 2009. This is highlighted in Figures 1 and 2 [1].
Figure 1: Total Development Expenditure, 2004 to 2018
DE dropped by 10% in absolute terms from 2009. The share that DE took of the total budget had fallen from 27.8% in 2010, a year into Najib’s tenure, to a paltry 17% in Budget 2018. On paper, such a decreasing trend of DE is fine if Malaysia has already achieved the status of a high-income nation, and no longer requires substantial federal investment in infrastructure. However, in reality, this is far from the case.
The issue of declining DE has been raised by numerous agencies and think-tanks, including the Penang Institute (PI) [2]; the Centre for Public Policy Studies (CPPS) [3]; the Socio-Economic Research Centre (SERC) [4]; and the Malaysian Rating Corporation Berhad (MARC) [5]; as well as prominent politicians, including Deputy Prime Minister Dr Wan Azizah Wan Ismail [6] and Deputy Minister of Defence Senator Liew Chin Tong [7]. According to an analysis conducted by The Edge newspaper, only 2.3% of federal revenue collection in 2018 was directed towards DE (the other 97.7% was to cover operating expenditures), and 88% of the DE in 2018 was to be financed by debt [8]. Both MARC, and Lee Heng Guie, the executive director of SERC, do not expect Malaysia to achieve its aim of a near-balanced budget by 2020 [9].
Figure 2: Shares of Total Budget, Operating Expenditure vs. Development Expenditure
The remainder of this paper analyses the federal DE in Malaysia during the course of Najib’s tenure. While aggregate DE had in itself been on a downward trajectory, particular Ministries and specific projects saw their allocations increase. The most dramatic increase involved the Prime Minister’s Department (PMD). The allocation breakdown of DE, by selected key Ministries and projects, are examined in greater detail in the following sections, in the interest of shedding some light on how the federal government allocated its money.
Deducing Top Government Priorities: PMD, PMD, PMD
In this section, we break down and analyse the trends in DE for the following Ministries: Prime
- Minister’s Department (PMD);
- Ministry of Defence (MOD); Ministry of Education (MOE); Ministry of Health (MOH);
- Ministry of Higher Education (MOHE); Ministry of Home Affairs (MOHA); Ministry of Public Works (MOPW);
- Ministry of Rural Development (MORD); and
- Ministry of Transportation (MOT).
These nine Ministries are singled out in particular for having attained the highest shares of DE in past Malaysian budgets.
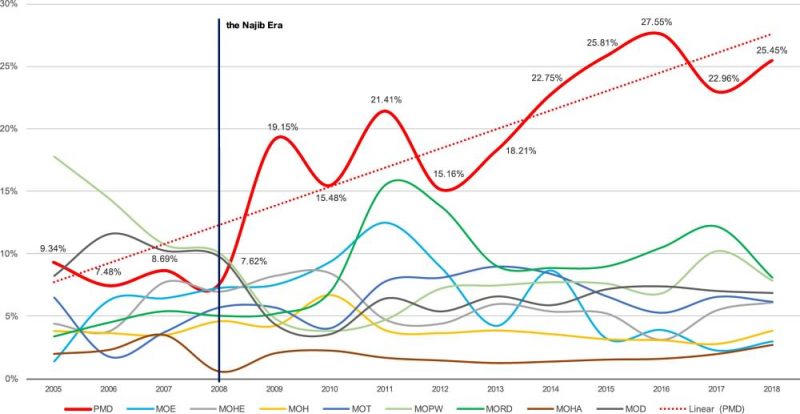
Figure 3 provides an overview of the trends in DE for the aforementioned “key” Ministries. Most striking was the rising share of DE allocated to the PMD after Najib took office in 2009, increasing from 7.62% in 2008 to over 25.45% in 2018, and peaking at 27.55% in 2016.
Figure 3: Shares of DE by Selected Ministries, 2005 to 2018
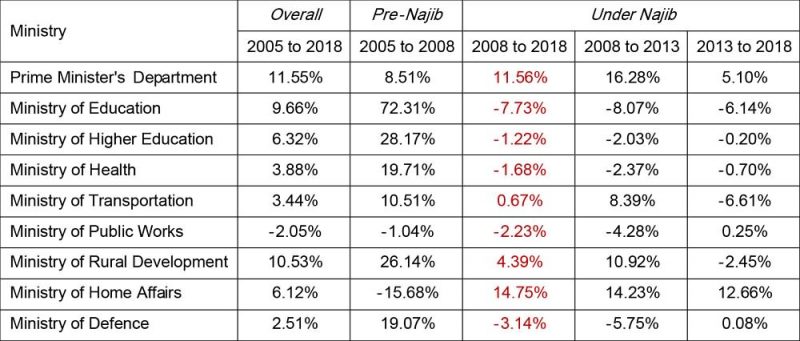
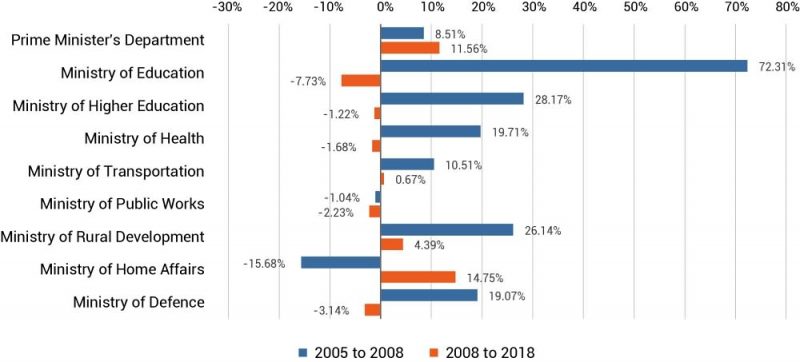
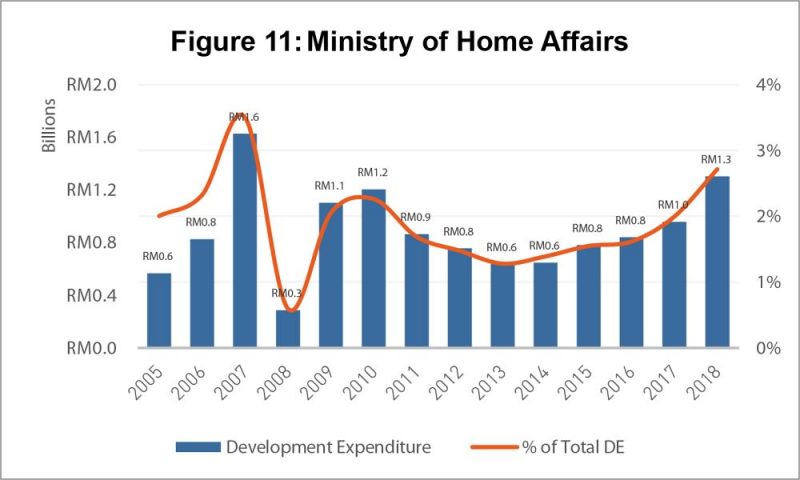
Table 1 and Figure 4 reveal that the only Ministries that had seen a positive (and significant) Compound Annual Growth Rate (CAGR) in DE over the duration of PM Najib’s tenure were the PMD; MORD; and MOHA. Since GE13 in 2013, only two Ministries enjoyed a positive CAGR in DE: the PMD and MOHA. While the MOHA saw a CAGR of 14.75% over this time period, it must be noted that its absolute DE increased from RM0.3bil in 2008 to RM1.3bil in 2018 was not significant when the full picture is taken into consideration.
These statistics, especially when compared against the CAGR in DE under Najib’s predecessor, Tun Abdullah Ahmad Badawi, serve to fortify the notion that under Najib, power was increasingly consolidated under the PMD, at the expense of other Ministries.
Table 1: Compound Annual Growth Rate (CAGR) in DE
Figure 4: Ministry-by-Ministry CAGR in DE
Development Expenditure Allocations to the PMD
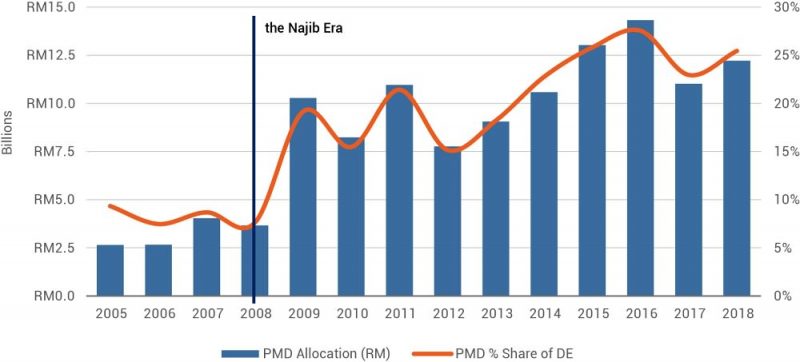
Table 2 and Figure 5 reveal the stark disparity in PMD DE between 2008, Abdullah’s final year in power, and 2009, Najib’s first year in power, with an increase in absolute terms of over 180%. This increase set the tone for the high absolute PMD DE figures seen during Najib’s whole tenure; only during three of his 10 years in charge did PMD DE drop below RM10bil. Even when taking into account historical trends in the growth rate of PMD DE, such a jump was abnormally large. The share of total DE that the PMD took under Najib’s premiership was similarly record-setting. This begets questions related to what the PMD spent its budgeted DE allocation on, and why the PMD under Najib was allocated such a high share of the overall DE budget in the first place.
The bottom three rows of Table 2 further illustrate the contrast in PMD DE prior to and during Najib’s tenure; between 2005 and 2008, the mean PMD DE was RM3.25bil (for an 8.3% share of DE); this figure rose to almost RM10.8bil (21.4% of DE) between 2009 and 2018. A further distinction is noticeable in the post-GE13 period, when the allocation averaged RM12.23bil, for a share of DE of almost 25%. This last figure represents a tripling of the PMD’s share of DE over the pre-Najib average, and reinforces the notion of a consolidation of power under the PMD during the Najib era.
Table 2: PMD Development Expenditure
Figure 5: PMD DE Allocation and Share of Total DE, 2005 to 2018
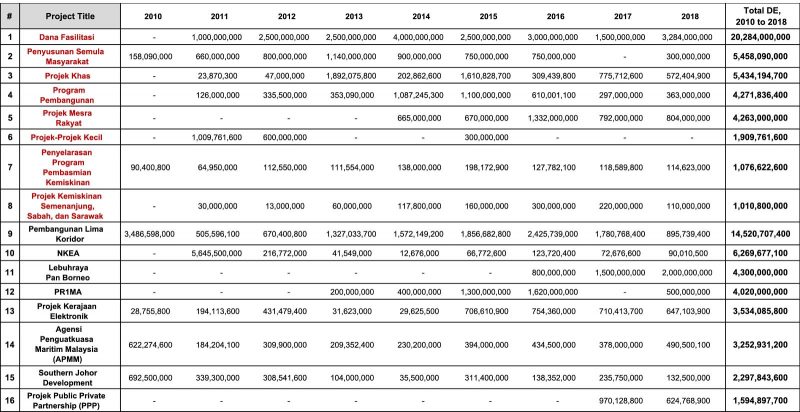
The next stage of this analysis examines the breakdown of the DE within the PMD under Najib. Of particular interest are individual projects within the PMD that were each allocated over RM1bil, in total, between 2010 and 2018. The full list of projects that fall into this category is presented in Table 3 (see page 9). Even within this list of projects, only some can be truly categorised as development projects – the first eight projects listed in Table 3 are more accurately categorised as “slush fund” projects. The list of “slush fund” projects, in decreasing amount of absolute DE allocation between 2010 and 2018, is as follows:
- Dana Fasilitasi (Facilitation Fund) allocated a total of RM20.28bil;
- Penyusunan Semula Masyarakat (Restructuring of Society), RM5.46bil;
- Projek Khas (Special Projects), RM5.43bil;
- Program Pembangunan (Development Programmes), RM4.27bil;
- Projek Mesra Rakyat (People-Friendly Projects), RM4.26bil;
- Projek-Projek Kecil (Small Projects), RM1.91bil;
- Penyelarasan Program Pembasmian Kemiskinan (Coordination Programmes for Poverty Eradication), RM1.08bil; and,
- Projek Kemiskinan Semenanjung, Sabah, dan Sarawak (Poverty Programmes in Peninsular Malaysia, Sabah and Sarawak), RM1.01bil.
These “slush fund” projects share one common characteristic, namely a severe lack of transparency. Details of these projects have not been publicly available. The issue of the existence of a “slush fund” within the PMD was first raised by Senator Liew Chin Tong [10].
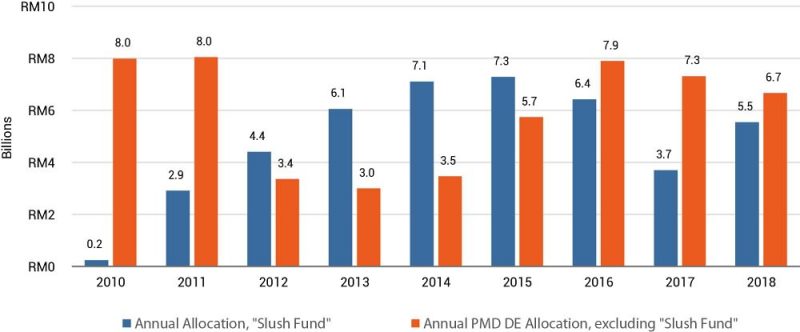
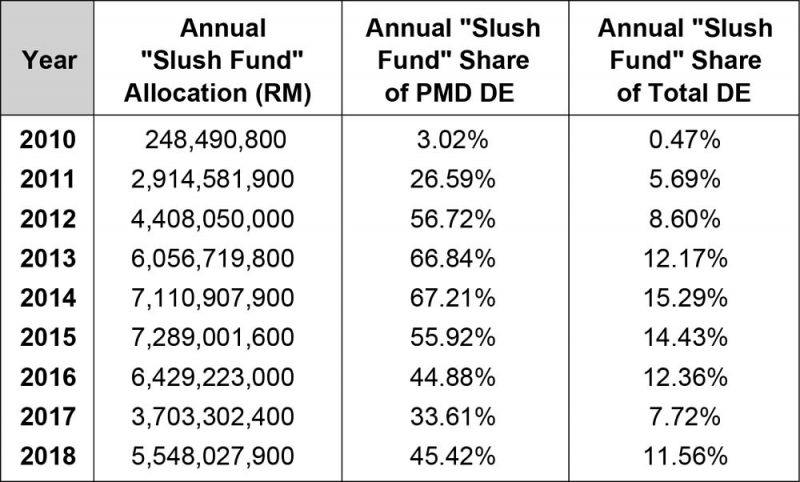
Table 4, presented on page 10, highlights these “slush fund” projects specifically, and provides further details of the total slush fund share of annual PMD DE, as well as individual “slush fund” project shares of PMD DE between 2010 and 2018. Over this time period, almost 45% of budgeted DE allocations to the PMD had been diverted to these eight projects. In terms of absolute figures, an astounding RM43.7bil were allocated towards the PMD’s “slush fund” projects over the past nine years. For the four years between 2012 and 2015, these projects consistently received over 55% of the share of PMD DE; in fact, in 2013 and 2014, the “slush fund” share of PMD DE was over two-thirds. Figure 6 illustrates graphically the breakdown of total DE allocations to the PMD between 2010 and 2018, between “slush fund” and “non-slush fund” uses. It highlights the fact that since 2012, the “slush fund” had attained a very significant component of total PMD DE.
Figure 6: Annual Breakdown of PMD DE Allocation
Some of this PMD DE were indeed allocated to what can be classified as economic development and infrastructure projects. These include Pembangunan Lima Koridor; Lebuhraya Pan Borneo; PR1MA; and Southern Johor Development, as well as allocations toward the “National Key Economic Areas”. Some of these big ticket infrastructure projects were awarded to politically connected individuals without any open tender. One prominent example is the Sarawak portion of the RM27 bil Pan Borneo highway, where the lucrative Project Delivery Partner (PDP) role was given to a little-known company controlled by the brother of then-Works Minister, Fadillah Yusof [11].
Questions should also be raised about the specific points of expenditure within Projek Public-Private Partnership (PPP); no information had been available regarding the projects that fall under the domain of the PPP, and it is thus unclear whether the total allocated DE of RM1.59bil between 2017 and 2018 was indeed used for carrying out federal development projects.
Table 3: PMD DE Projects and Budgeted Allocations in RM, 2010 to 2018
Table 4: “Slush Fund” Projects
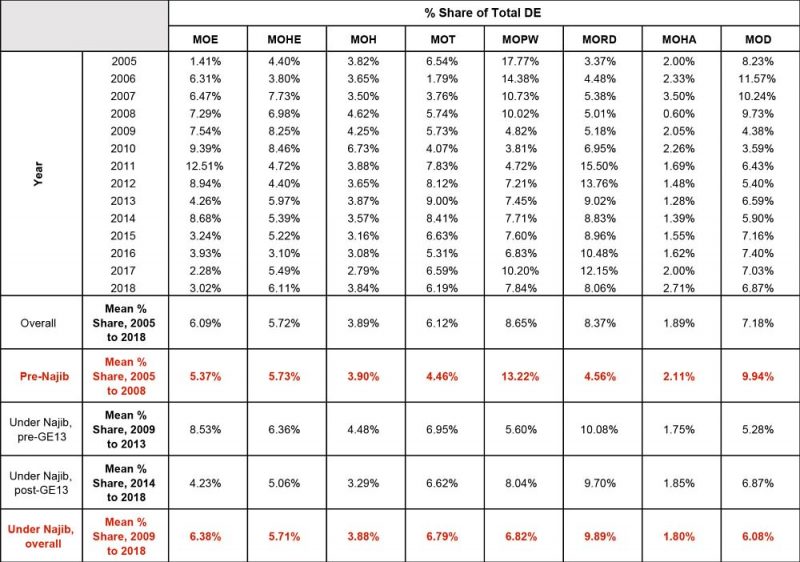
Table 5: Ministry-by-Ministry Breakdown of DE Shares
Key Ministries at a Glance (excluding PMD)
Table 5 provides a detailed, year-by-year breakdown of the DE shares of the selected key
Ministries, and lists the average DE shares of these Ministries, grouped into specific time periods.
Warranting special attention are the Ministries whose shares of DE shifted significantly during Najib’s tenure. The two rows describing these changes are highlighted in red. The starkest differences involve the MOPW, whose share decreased from an average of 13.22% between 2005 and 2008, to an average of 6.82% between 2009 and 2018; the MORD, increasing from 4.56% to 9.89%; and, the MOD, decreasing from 9.94% to 6.08%. The MOT saw a smaller change, rising from 4.46% to 6.79%.
Also worth noticing are changes in the DE shares of these Ministries under Najib’s tenure, before and after GE13. It is reasonable to assume that some of the PM’s priorities shifted following the close, and controversial, results of the 2013 Elections. Again, of particular interest here are the larger disparities between the DE shares of these Ministries across these time periods. The MOE saw its share more than halved, from 8.53% between 2009 and 2013 to 4.23% between 2014 and 2018. The MOHE saw a decrease from 6.36% to 5.06%, and the MOH from 4.48% to 3.29%.
Ministries that enjoyed an increasing share of DE between the pre- and post-GE13 time periods include the MOPW, from 5.6% to 8.04%, and the MOD, from 5.28% to 6.87%. However, these two Ministries endured a sharp drop in their DE shares during Najib’s first term anyway, and these increases still left them well below their pre-Najib averages.
These statistics reveal that apart from the PMD, the only Ministry that attained a growing share of total DE under the Najib Administration was the Ministry of Rural and Regional Development – a Ministry largely focused on supporting Bumiputera communities.
Development Expenditure across Selected Key Ministries
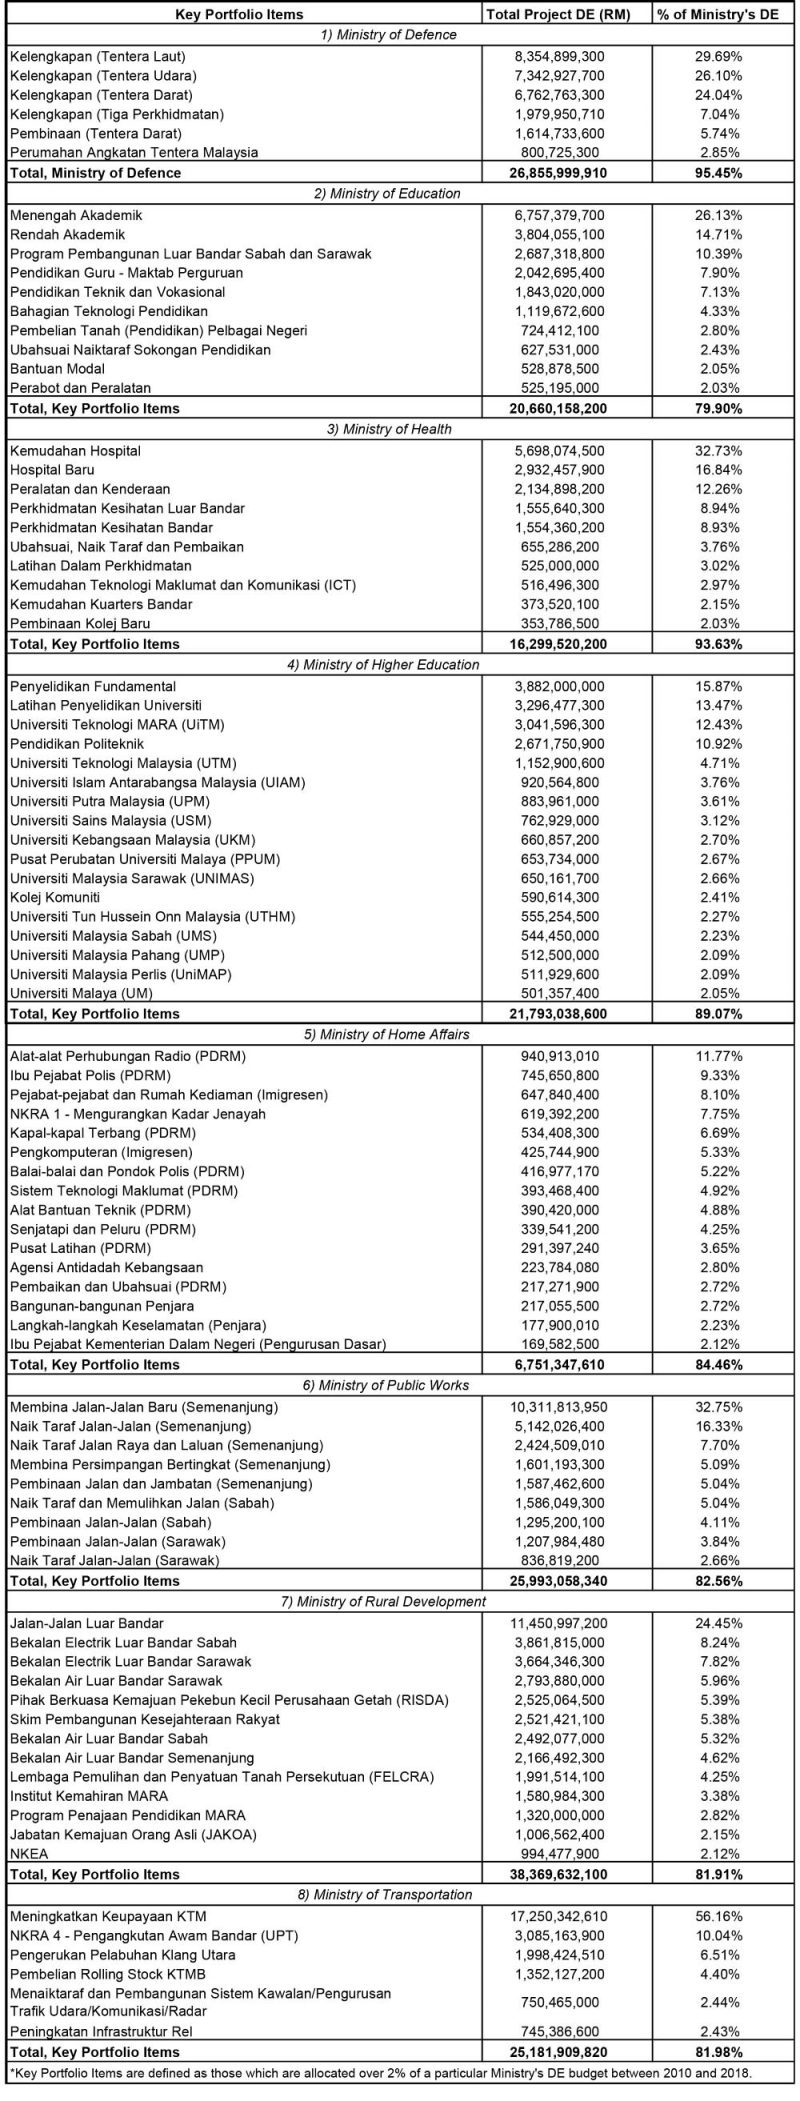
Table 6 (see pages 17 and 18) summarises budgeted DE allocations towards the key portfolio items of the key Ministries selected for analysis in this study. Key portfolio items are defined as those which were allocated over 2% of a particular Ministry’s DE budget in the period between 2010 and 2018. For the Ministries of Education; Home Affairs; Public Works; Rural Development; and Transportation, these key portfolio items accounted for around 80% of each Ministry’s 2010 to 2018 DE budget. For the Ministries of Defence; Health; and Higher Education, the figures were close to, or exceed, 90%.
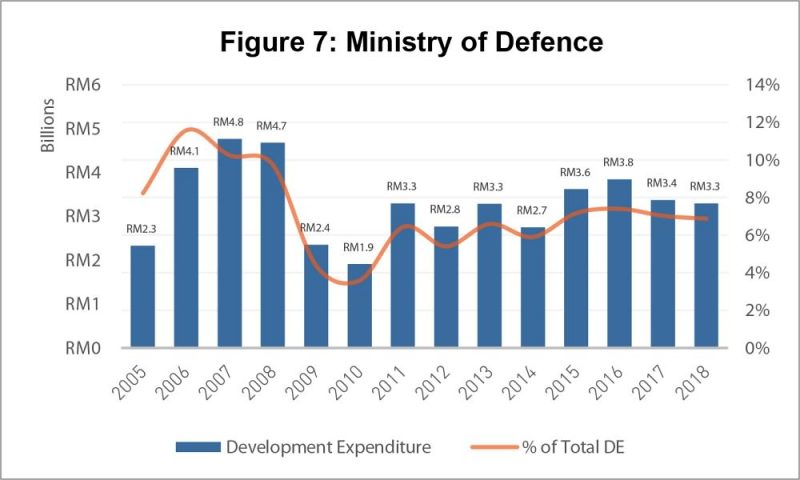
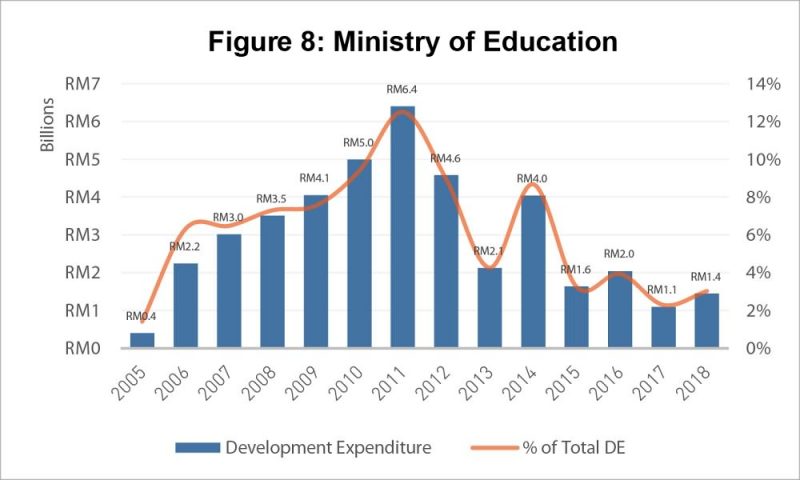
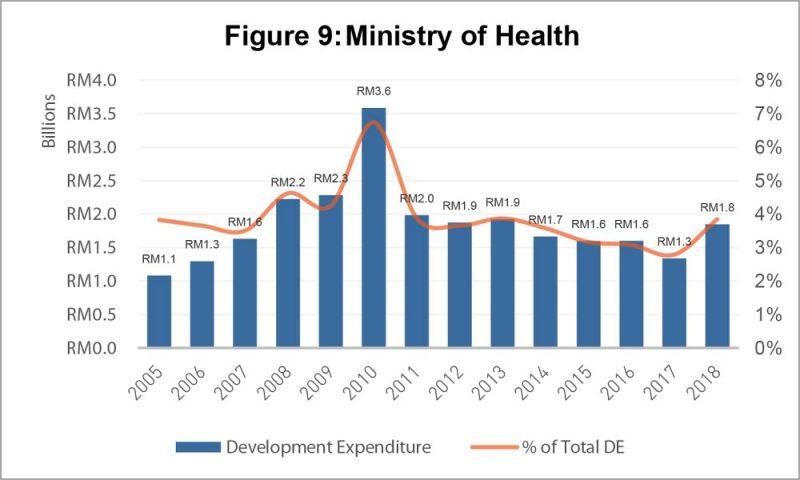
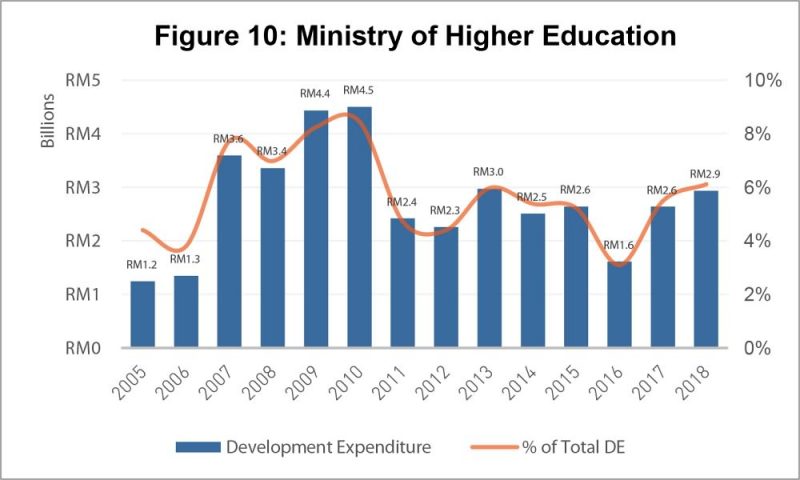
Graphical representations of each of these Ministries’ absolute DE, and subsequent shares of total DE, are presented in Figures 7 through 14 (see pages 15 and 16) of this report.
Ministry of Defence
Of all ministries analysed in this study, the MOD had the highest share of its 2010 to 2018 DE budget allocated towards key portfolio items, at 95.45%. This figure equates to almost RM27bil in total DE expenditure during this time period. Of this, almost RM24.5bil, or 87% of MOD DE, was budgeted for the purchases of equipment for the Army, Air Force and Navy. It is also worth recalling that, of all Ministries, the MOD was subjected to one of the largest DE share decreases during Najib’s tenure.
Ministry of Education
At just under 80%, the MOE had the lowest share of its budgeted DE allocated towards key portfolio items. Combined spending on primary and secondary education accounted for RM10.6bil, or almost 41%, of the total MOE DE budget between 2010 and 2018. A further 10% was allocated towards the development of rural education infrastructure in Sabah and Sarawak; almost 8% towards college education for teachers; and just over 7% for technical and vocational training programmes. It is worth recalling that following GE13, the amount of money allocated towards MOE DE was more than halved. Given that high-quality primary and secondary education is routinely shown to have strong positive associations with future economic returns, and assuming that MOE DE on primary and secondary education, as well as training for teachers, improves the quality of education in Malaysian schools, this represents a highly concerning situation.
Ministry of Health
Section 3.0 revealed that the MOH saw its share stagnate during Najib’s tenure as PM, having accounted for 3.90% of total DE between 2005 and 2008, and 3.88% of total DE under Najib. Almost a third of MOH DE between 2010 and 2018 was allocated towards hospital facilities, and almost 17% towards the building of new hospitals. Just over 12% of MOH DE during this time period was spent on equipment and vehicles, including ambulances, and a further 9% was allocated towards health services in urban and rural areas each. In total, almost 80% of MOH DE was reserved for these five items. With this in mind, it is apparent that any cuts to MOH DE would have an adverse effect on the availability and quality of government-provided healthcare services for the Rakyat.
Ministry of Higher Education
As with the MOH, the MOHE saw its share of total DE stagnate during Najib’s tenure as PM (5.73% prior to his inauguration, and 5.71% post-inauguration). Almost 30% of MOHE DE between 2010 and 2018 was allocated towards basic research (no comma) and research training. Of all the public higher education institutions in the nation, University Teknologi MARA (UiTM) received the highest share of MOHE DE during this period, at just under 12.5%. To put this figure into perspective, the institution that received the next highest share of MOHE DE was University Teknologi Malaysia (UTM), at 4.71% – less than 40% of the UiTM share. Given UiTM’s history as a heavily Bumiputera-leaning institution, this indicated a strong level of racial bias within MOHE DE.
Ministry of Home Affairs
Of all Ministries included in this study, the MOHA received the lowest share of total DE, at 2.11% between 2005 and 2008, and dropping by almost 15%, to 1.8%, during Najib’s tenure. Of the MOHA’s top 10 expenditure items between 2010 and 2018, seven were allocated towards Polis Diraja Malaysia (PDRM). These seven items alone accounted for over half of MOHA DE during this time period, with a further 7.75% allocated towards NKRA [12], whose aim is a reduction in the crime rate. This indicates a heavy level of bias within MOHA DE towards PDRM.
Ministry of Public Works
Earlier, it was highlighted that of all ministries, the total DE share allocated towards the MOPW
dropped most significantly during the course of Najib’s tenure, from over 13% between 2005 and 2008, to under 7% between 2009 and 2018. All its key portfolio items between 2010 and 2018 were related to roadworks; within this, over two-thirds of MOPW DE were allocated towards roadworks in Peninsular Malaysia, and a further 16% for road construction and upgrades in Sabah and Sarawak. By far the largest expenditure item throughout this time period was the building of new roads in the Peninsular, accounting for almost a third (or over RM10.3bil) of MOPW DE.
Ministry of Rural Development
In stark contrast to the MOPW, the share of total DE allocated towards the MORD more than doubled during Najib’s tenure, from an average of 4.56% between 2005 and 2008, to an average of almost 10% in the decade that followed. Since 2010, almost 25% (or RM11.45bil) of MORD DE was allocated towards the development of road networks in rural areas. Given that a significant mandate of the MOPW itself was related to roadworks, it is slightly puzzling that further road development work fell under the jurisdiction of the MORD. Over 27% of MORD DE was allocated towards developing the supply of electricity and water in rural areas of Sabah and Sarawak, and just under 5% towards the supply of water in rural areas of Peninsular Malaysia. Rounding off the list of the MORD’s key portfolio items were budgeted allocations towards RISDA, FELCRA, MARA, and JAKOA [13], accounting for roughly 17%, or RM6.84bil, of MORD DE between 2010 and 2018. Importantly, these four corporations had all been subjects of controversies or corruption scandals in recent years [14].
Ministry of Transportation
Since 2010, over 56% (RM17.25bil) of MOT DE was allocated towards enhancing the capabilities of the KTM system. However, it is unclear whether such drastic spending had any significantly positive effects on KTM system performance. A further RM1.35bil was allocated towards the purchase of rolling stocks for KTM Berhad. In addition, NKRA 4, related to improvements in urban public transport, was allocated RM10bil (over 10% of MOT DE) between 2010 and 2018. Together, these five items alone accounted for nearly 80% of MOT DE during this time period.
Figure 7: Ministry of Defence
Figure 8: Ministry of Education
Figure 9: Ministry of Health
Figure 10: Ministry of Higher Education
Figure 11: Ministry of Home Affairs
Figure 12: Ministry of Public Works
Figure 13: Ministry of Rural Development
Figure 14: Ministry of Transportation
Table 6: Key Portfolio Items* by Ministry, 2010 to 2018
Analysing Crowding Out Effects of the PMD’s “Slush Fund”
This analysis has thus far indicated a stagnating trend in absolute DE; a decreasing trend in DE across a number of key Ministries; and, a starkly increasing trend in PMD DE- in terms of both absolute spending, and share oftotal DE. Further, it has been revealed that a significant proportion of PMD DE was diverted to what has been classified as “slush fund” projects. Questions have to be raised with regard to where funding for the “slush fund” came from. The stagnation in absolute DE over the course of Najib’s tenure as PM offers strong evidence for a possible answer: it came at the expense of DE allocations to other Ministries.
Table 7: Summary Statistics, PMD “Slush Fund”
Table 7 provides summary statistics for the PMD “slush fund”. The first two columns, related to the absolute “slush fund” allocation by year, and the subsequent “slush fund” share of PMD DE, are reproduced from Table 4. The third column is a calculation of the annual”slush fund” share of total DE. Were the “slush fund” to act as a Ministry on its own, 1ts average share of total Malaysian DE during the Najib era would have exceeded the shares of all key Ministries in this study- with the exception of the PMD.
Particular attention has been paid to the Ministries of Education, Health, and Higher Education. After the creation of the “slush fund” within the PMD, the shares of total DE of these three Ministries dropped significantly. A general trend was apparent: as the “slush fund” share of total DE rose, the combined DE share of the MOE, MOH, and MOHE decreased. This relationship held true for most of Najib’s tenure.
Table 8 provides, first, a breakdown of the individual DE shares of these three Ministries, and the “slush fund”; second, the year-on-year changes in the annual combined shares of these Ministries, and the “slush fund”; and, third, the change in the percentage share of these Ministries, and the “slush fund”, relative to 2010 baseline figures. It shows that for the 2010 to 2018 period, a DE share decrease of 11.61% for the Ministries was matched by a cumulative DE share increase of 11.56% for the “slush fund”. This indicates a degree of “crowding out” of DE funding to these Ministries, in favour of the “slush fund”.
Table 8: Crowding Out Effects of PMD “Slush Fund” on Ministries’ DE Share
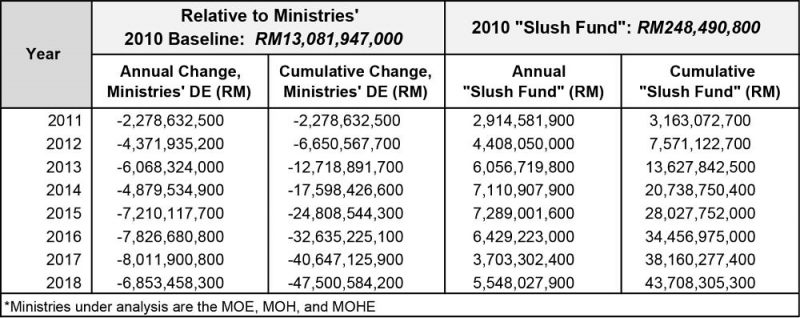
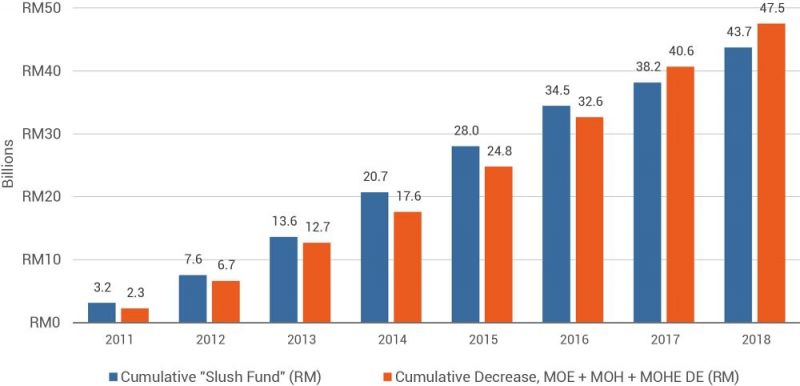
Table 9 goes even further still. In 2010, combined DE for these three Ministries was RM13.08bil. Since that was the year these PMD “slush funds” came into existence, this figure is used as a baseline for this particular analysis. The first column of Table 9 looks at the year-by-year change in absolute DE for these Ministries, relative to the 2010 baseline. The second column calculates cumulative changes in these Ministries’ DE – a combination of the annual changes in the first column – up to 2018. The third column again refers to the annual “slush fund” allocation between 2011 and 2018. The fourth column presents cumulative DE allocations to the PMD “slush fund”, up to 2018.
Table 9: Crowding Out Effects of PMD “Slush Fund” on Ministries’ Absolute DE
There are striking similarities in both the annual changes, and cumulative figures between these Ministries’ DE, and the slush fund. For instance, these Ministries’ combined DE in 2013 was down RM6.07bil from the 2010 baseline, while the “slush fund” allocation that same year was RM6.08bil; cumulatively, by 2013 these Ministries’ combined DE was down RM12.72bil from the 2010 baseline, while the “slush fund” had amassed an allocation of RM13.63bil. If one were to repeat this exercise for each year, the same story of highly similar figures would play out. Figure 15 below visually depicts these similarities in the cumulative figures.
It should be noted that these figures, while similar, do not equate exactly. However, this is to be expected, and is likely due to two key reasons. First, DE allocations may have been diverted from other Ministries to the “slush fund”, besides the three under analysis in this section. Secondly, funds may have also been diverted towards the PMD’s DE allocation more generally, rather than to the “slush fund” projects specifically. Regardless, the similarities between these annual and cumulative figures serve to reinforce the notion that there was a high degree of crowding out of DE from particular Ministries, towards the PMD’s “slush fund”.
Figure 15: Cumulative “Slush Fund” vs. Cumulative Decrease in MOE + MOH + MOHE
Concluding Remarks
Under the premiership of Najib Razak, Malaysia’s DE stagnated in absolute terms and saw its share of the total Federal Budget diminish greatly. Beneath the surface of this aggregate statistic, this report has traced a trend of increasing DE allocations to the Prime Minister’s Department, culminating in a major consolidation of spending power under the PMD, and consequently, Najib himself. To add to this highly disconcerting situation, just under half of the DE allocations to the PMD was in turn diverted to what can only be accurately described as “slush fund” projects.
The stagnation of headline DE figures over the past decade indicates that there was a significant level of crowding out of allocations towards particular Ministries that should naturally play a major role in the development of public infrastructure, in favour of the PMD’s “slush fund”. Taken together, the allocation patterns for DE in the federal budget paint a disturbing picture of economic and political development in Malaysia; one where the principles of democracy, transparency, and accountability were deprioritised in favour of greater powers of discretion in the hands of the Prime Minister and the department under his jurisdiction.
[1] These, and all figures and tables presented in this paper, are derived from statistics available on the Ministry of Finance website, http://www.treasury.gov.my/.
[2] https://penanginstitute.org/v3/media-centre/press-releases/1020-press-statement-from-penang-institute-on-budget-2018
[3] http://cpps.org.my/publications/comments-on-budget-2018/
[4] http://www.freemalaysiatoday.com/category/nation/2017/10/29/economist-calls-for-rebalancing-of-expenditures-in-bu dget-2018/
[5] https://www.marc.com.my/index.php/economic-research/periodic-reports/periodic-tables-2017/908-budget-2018-raky ats-well-being-take-centre-stage20171030/file
[6] https://www.malaysiakini.com/news/400072
[7] https://www.liewchintong.com/2017/11/01/development-allocation-najib-not-rakyat/
[8] http://www.theedgemarkets.com/article/budget-2018-when-debt-fuels-and-holds-back-development-expenditure
[9] https://www.nst.com.my/business/2017/10/296925/malaysia-making-progress-reduce-debt-marc
[10] http://www.themalaymailonline.com/malaysia/article/slush-funds-in-budget-for-pms-department-deplorable-says-mp
[11] https://www.thestar.com.my/business/business-news/2015/07/04/little-known-lbu-lands-lucrative-job-in-sarawak/
[12] NKRA: National Key Result Areas, which represent efforts by Malaysia’s (past) ruling government to address a total of seven key areas concerning the Rakyat under the Government Transformation Programme (GTP).
[13] RISDA: Rubber Industry Smallholders Development Authority; FELCRA: Federal Land Consolidation and
Rehabilitation Authority; MARA: People’s Trust Council; JAKOA: Department of Orang Asli Development
[14] Examples of controversies and/or corruption scandals involving these government agencies –
RISDA:
https://www.thestar.com.my/news/nation/2018/01/05/peter-anthony-arrested-over-rm155mil-risda-land-deal/;
FELCRA:
http://www.themalaymailonline.com/malaysia/article/felcra-directors-paid-themselves-without-ministry-nod-pac-says;
MARA:
http://www.smh.com.au/federal-politics/political-news/the-australian-building-that-made-almost-20m-for-corrupt-malaysians-20180126-p4yyxd.html;
JAKOA:
After 60 years, Malaysia’s forgotten people, still forgotten
Managing Editor: Ooi Kee Beng, Editorial Team: Regina Hoo, Lim Su Lin, Nur Fitriah, Ong Wooi Leng
You might also like:

Tighter Collaboration Needed in Penang’s Skills Development Infrastructure

The Digital Free Trade Zone – A Path to Inclusive Growth?

EU-Malaysia Trade Ties Strengthen despite Persistent Differences

Key Measures Identified for Strengthening STEM Interest among Students in Penang

Ecotourism: A Sector where Sustainability is Everything


